CHCHD3
[ENSRNOP00000018001]
Main page
| | | Plot |
Mito |
Lyso |
|
Perox |
ER |
Golgi |
PM |
Cytosol |
Nucleus |
|
| Expt A |
 7
7
peptides |
31
spectra |
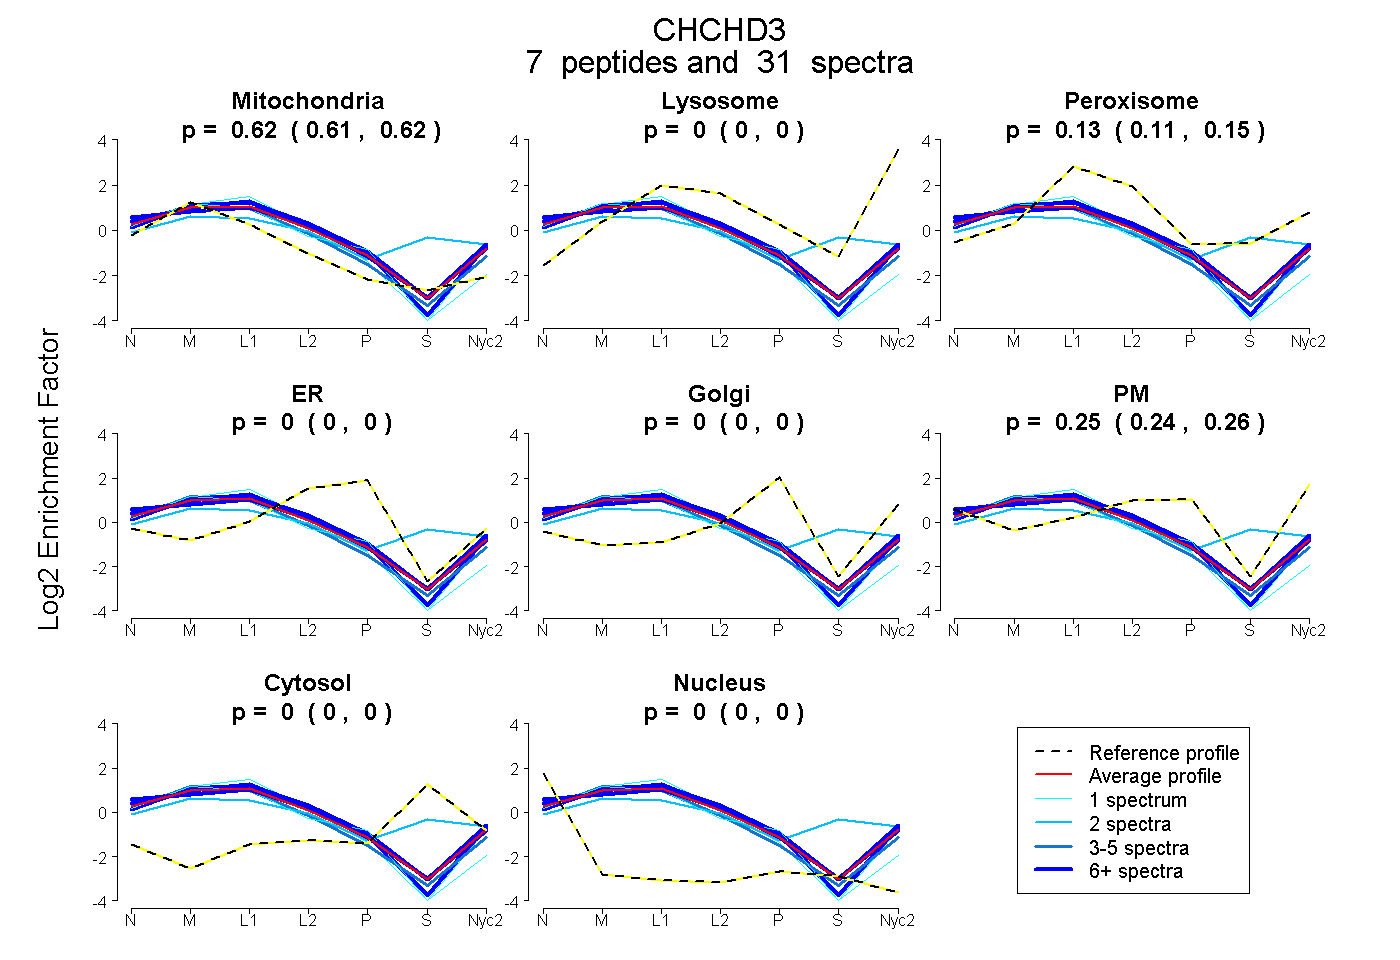 |
0.618
0.608 | 0.625 |
0.000
0.000 | 0.000 |
|
0.131
0.110 | 0.150 |
0.000
0.000 | 0.004 |
0.000
0.000 | 0.000 |
0.251
0.235 | 0.264 |
0.000
0.000 | 0.000 |
0.000
0.000 | 0.000 |
|
| | | Plot |
Mito |
|
Lyso or Perox |
|
ER |
Golgi |
PM |
Cytosol |
Nucleus |
|
| Expt B |
8
peptides |
23
spectra |
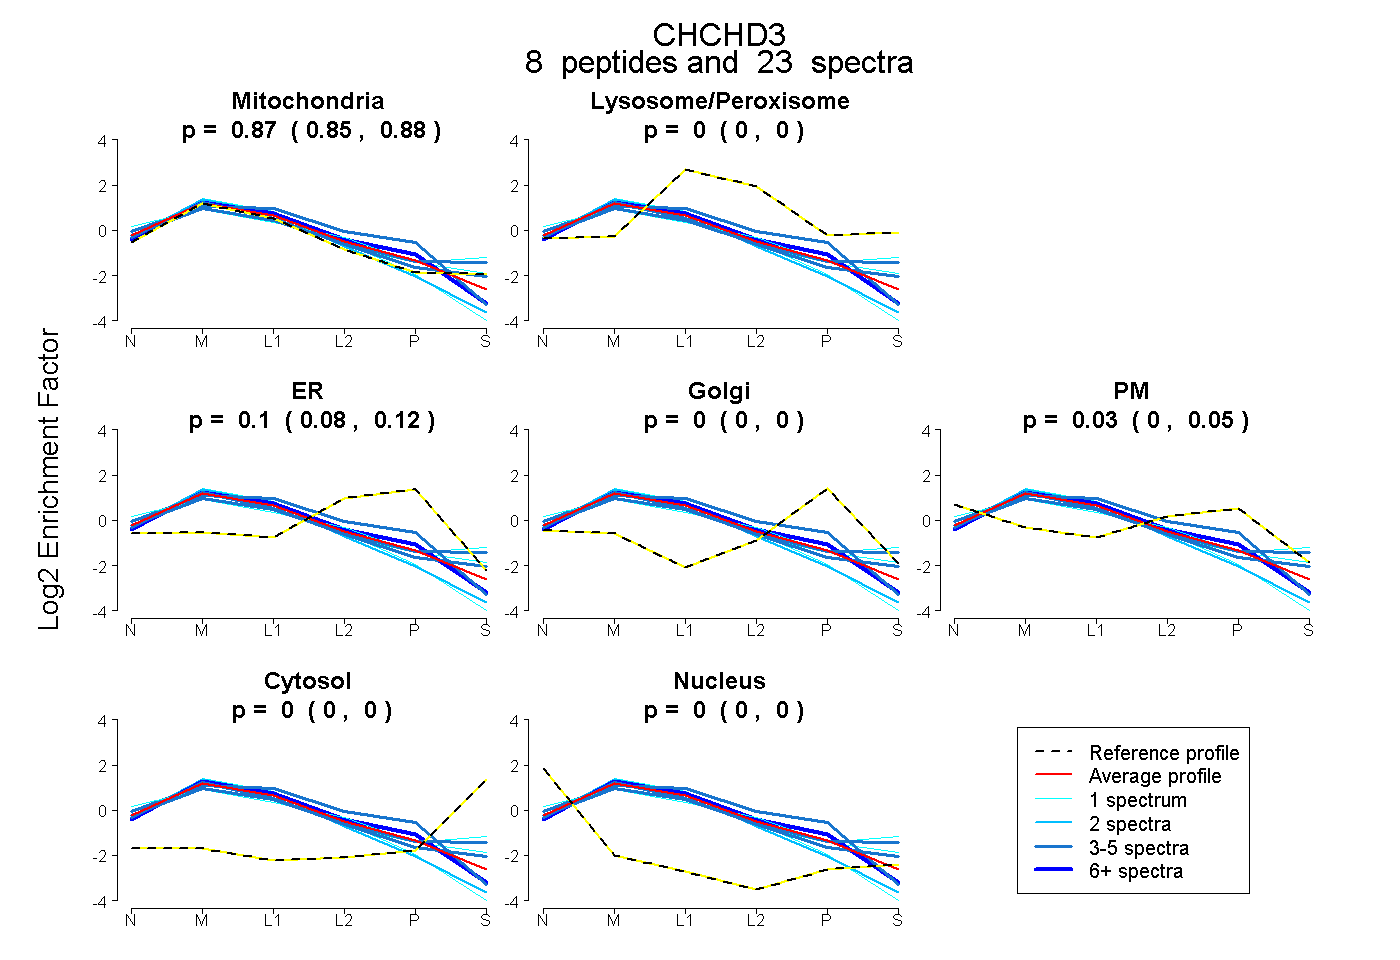 |
0.866
0.851 | 0.880 |
|
0.000
0.000 | 0.000 |
|
0.104
0.077 | 0.124 |
0.000
0.000 | 0.000 |
0.030
0.004 | 0.051 |
0.000
0.000 | 0.000 |
0.000
0.000 | 0.000 |
|
| 8 spectra, AVANEQLTR |
0.818 |
|
0.000 |
|
0.182 |
0.000 |
0.000 |
0.000 |
0.000 |
|
| 3 spectra, LSENVIDR |
0.917 |
|
0.009 |
|
0.000 |
0.000 |
0.075 |
0.000 |
0.000 |
|
| 1 spectrum, AAEEVESK |
0.996 |
|
0.000 |
|
0.004 |
0.000 |
0.000 |
0.000 |
0.000 |
|
| 1 spectrum, AILEQR |
0.846 |
|
0.027 |
|
0.000 |
0.000 |
0.128 |
0.000 |
0.000 |
|
| 3 spectra, VAEELALEQAK |
0.749 |
|
0.090 |
|
0.000 |
0.000 |
0.125 |
0.036 |
0.000 |
|
| 1 spectrum, SSEFYK |
0.641 |
|
0.151 |
|
0.000 |
0.000 |
0.141 |
0.028 |
0.039 |
|
| 2 spectra, ALLQER |
1.000 |
|
0.000 |
|
0.000 |
0.000 |
0.000 |
0.000 |
0.000 |
|
| 4 spectra, ILQCYR |
0.692 |
|
0.003 |
|
0.304 |
0.000 |
0.000 |
0.000 |
0.000 |
|
| | | Plot |
|
Lyso |
|
|
|
|
|
|
|
Other |
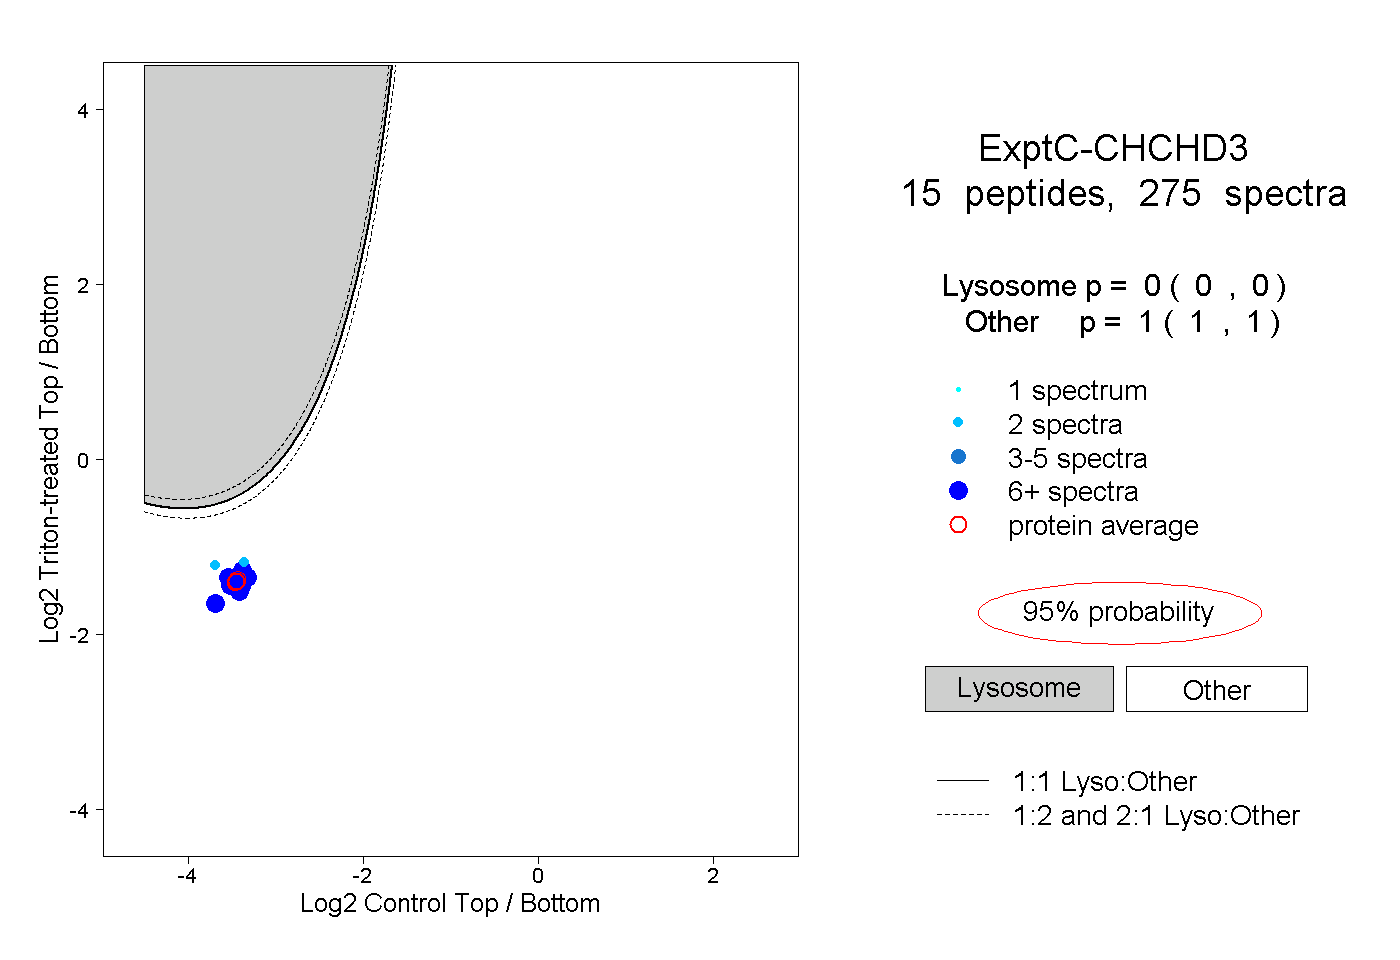
| Expt C |
15
peptides |
275
spectra |
 |
|
0.000
0.000 | 0.000 |
|
|
|
|
|
|
|
1.000
1.000 | 1.000 |
| | | Plot |
|
Lyso |
|
|
|
|
|
|
|
Other |
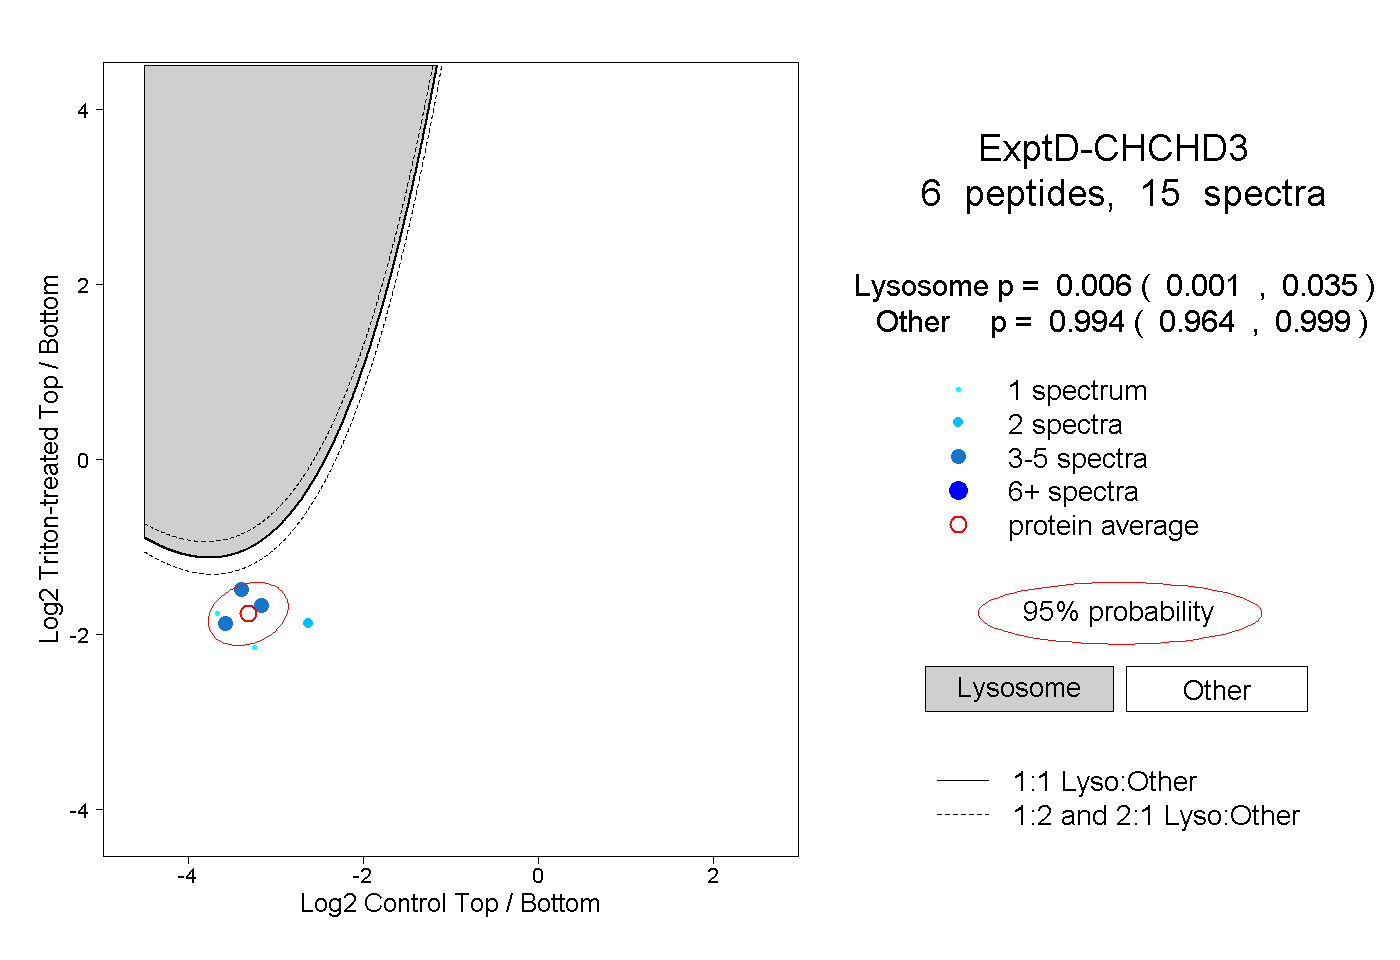
| Expt D |
6
peptides |
15
spectra |
 |
|
0.006
0.001 | 0.035 |
|
|
|
|
|
|
|
0.994
0.964 | 0.999 |