 7
7peptides
spectra
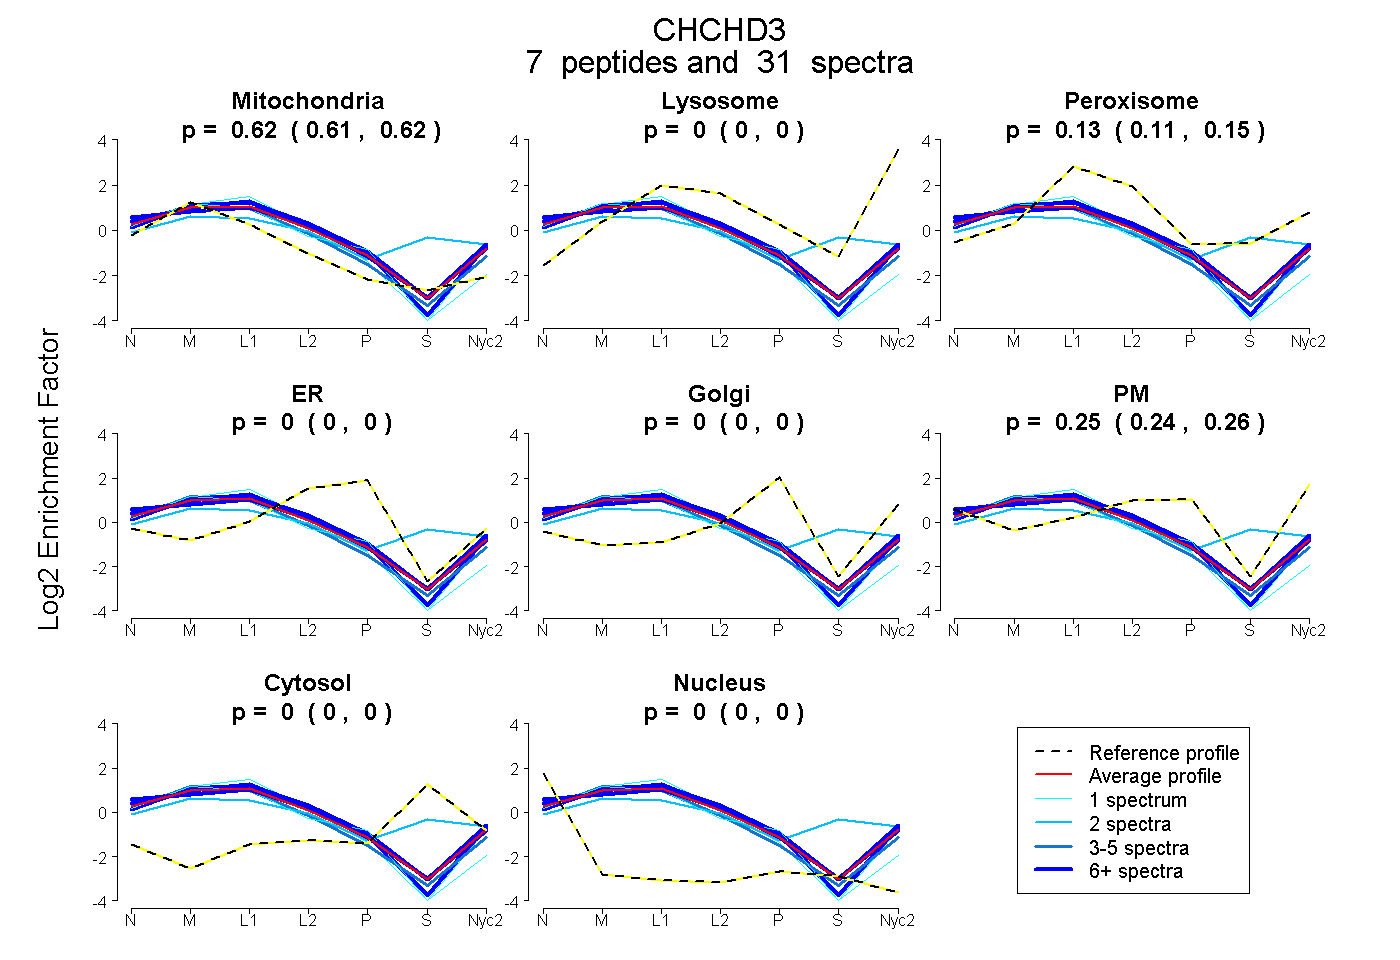
0.608 | 0.625
0.000 | 0.000
0.110 | 0.150
0.000 | 0.004
0.000 | 0.000
0.235 | 0.264
0.000 | 0.000
0.000 | 0.000
| Plot | Mito | Lyso | Perox | ER | Golgi | PM | Cytosol | Nucleus | |||||
| Expt A |
7 peptides |
31 spectra |
|
0.618 0.608 | 0.625 |
0.000 0.000 | 0.000 |
0.131 0.110 | 0.150 |
0.000 0.000 | 0.004 |
0.000 0.000 | 0.000 |
0.251 0.235 | 0.264 |
0.000 0.000 | 0.000 |
0.000 0.000 | 0.000 |
| 6 spectra, AVANEQLTR | 0.599 | 0.000 | 0.067 | 0.000 | 0.000 | 0.333 | 0.000 | 0.000 | ||
| 1 spectrum, AAEEVESK | 0.660 | 0.000 | 0.093 | 0.000 | 0.000 | 0.247 | 0.000 | 0.000 | ||
| 10 spectra, VAEELALEQAK | 0.604 | 0.000 | 0.118 | 0.000 | 0.000 | 0.277 | 0.000 | 0.000 | ||
| 2 spectra, ISSEENR | 0.384 | 0.000 | 0.365 | 0.000 | 0.000 | 0.007 | 0.243 | 0.000 | ||
| 1 spectrum, SSEFYK | 0.755 | 0.000 | 0.000 | 0.245 | 0.000 | 0.000 | 0.000 | 0.000 | ||
| 8 spectra, MESENQR | 0.558 | 0.000 | 0.181 | 0.012 | 0.000 | 0.250 | 0.000 | 0.000 | ||
| 3 spectra, ILQCYR | 0.738 | 0.000 | 0.080 | 0.000 | 0.000 | 0.182 | 0.000 | 0.000 |
| Plot | Mito | Lyso or Perox | ER | Golgi | PM | Cytosol | Nucleus | ||||||
| Expt B |
8 peptides |
23 spectra |
 |
0.866 0.851 | 0.880 |
0.000 0.000 | 0.000 |
0.104 0.077 | 0.124 |
0.000 0.000 | 0.000 |
0.030 0.004 | 0.051 |
0.000 0.000 | 0.000 |
0.000 0.000 | 0.000 |
|||
| Plot | Lyso | Other | |||||||||||
| Expt C |
15 peptides |
275 spectra |
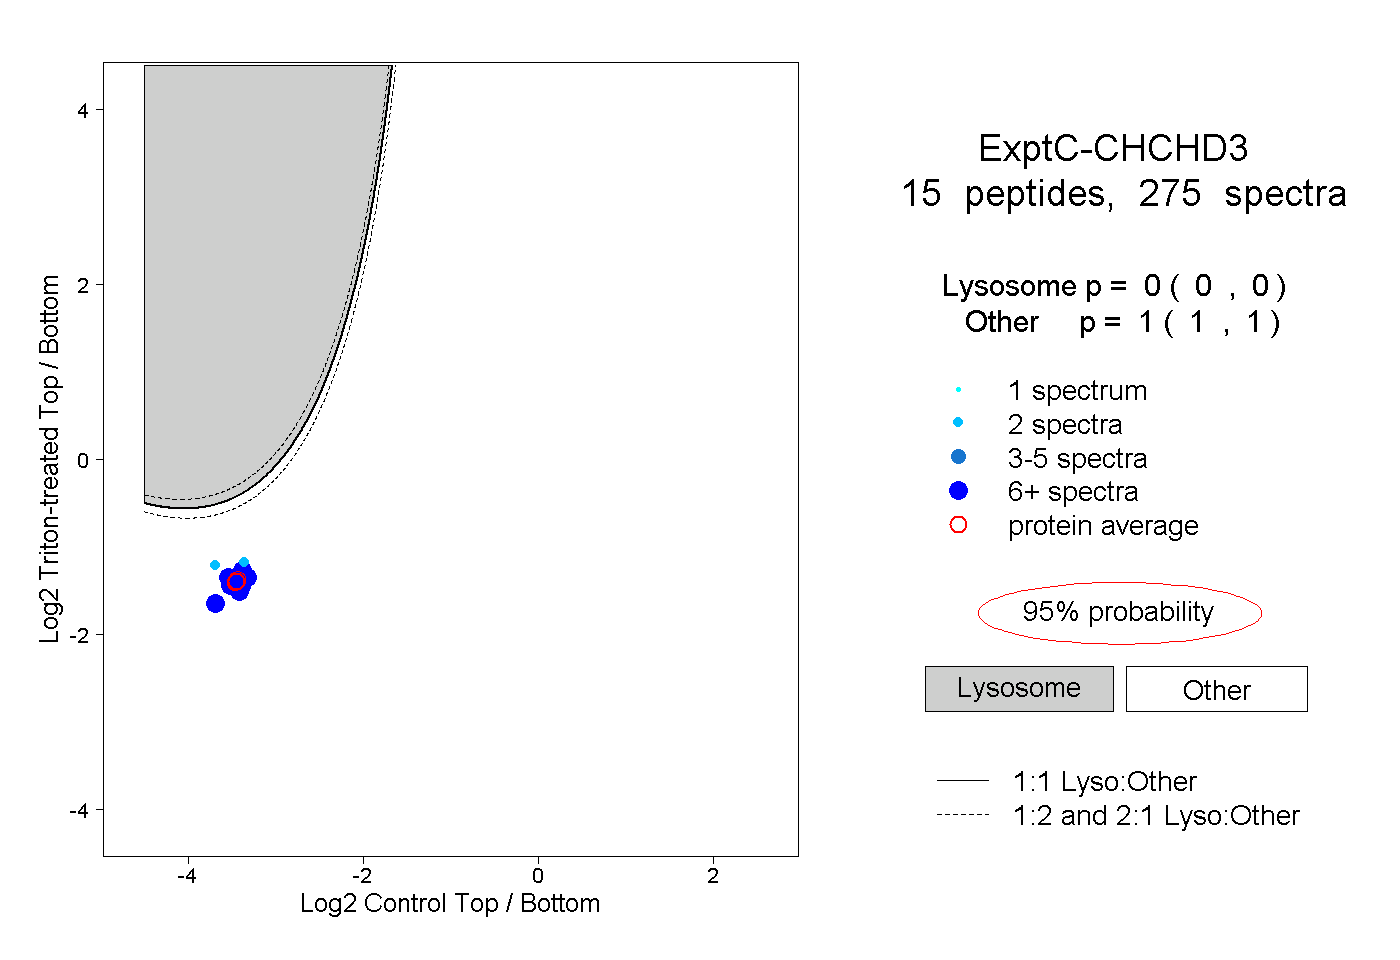 |
0.000 0.000 | 0.000 |
1.000 1.000 | 1.000 |
||||||||
| Plot | Lyso | Other | |||||||||||
| Expt D |
6 peptides |
15 spectra |
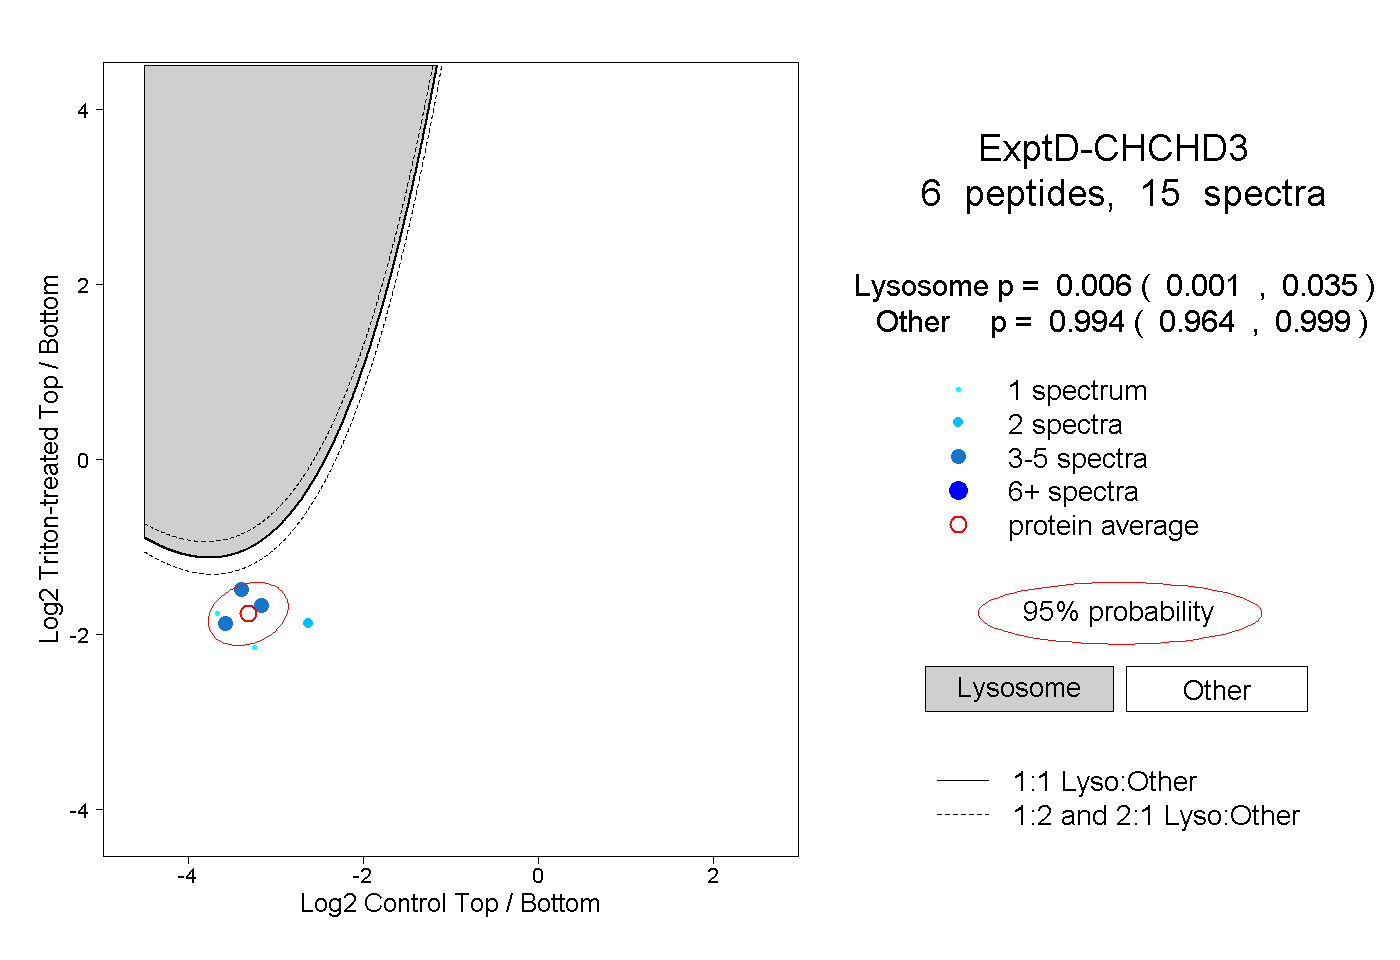 |
0.006 0.001 | 0.035 |
0.994 0.964 | 0.999 |