 2
2peptides
spectra
0.000 | 0.000
0.000 | 0.000
0.000 | 0.150
0.242 | 0.570
0.000 | 0.080
0.000 | 0.235
0.315 | 0.484
0.000 | 0.024
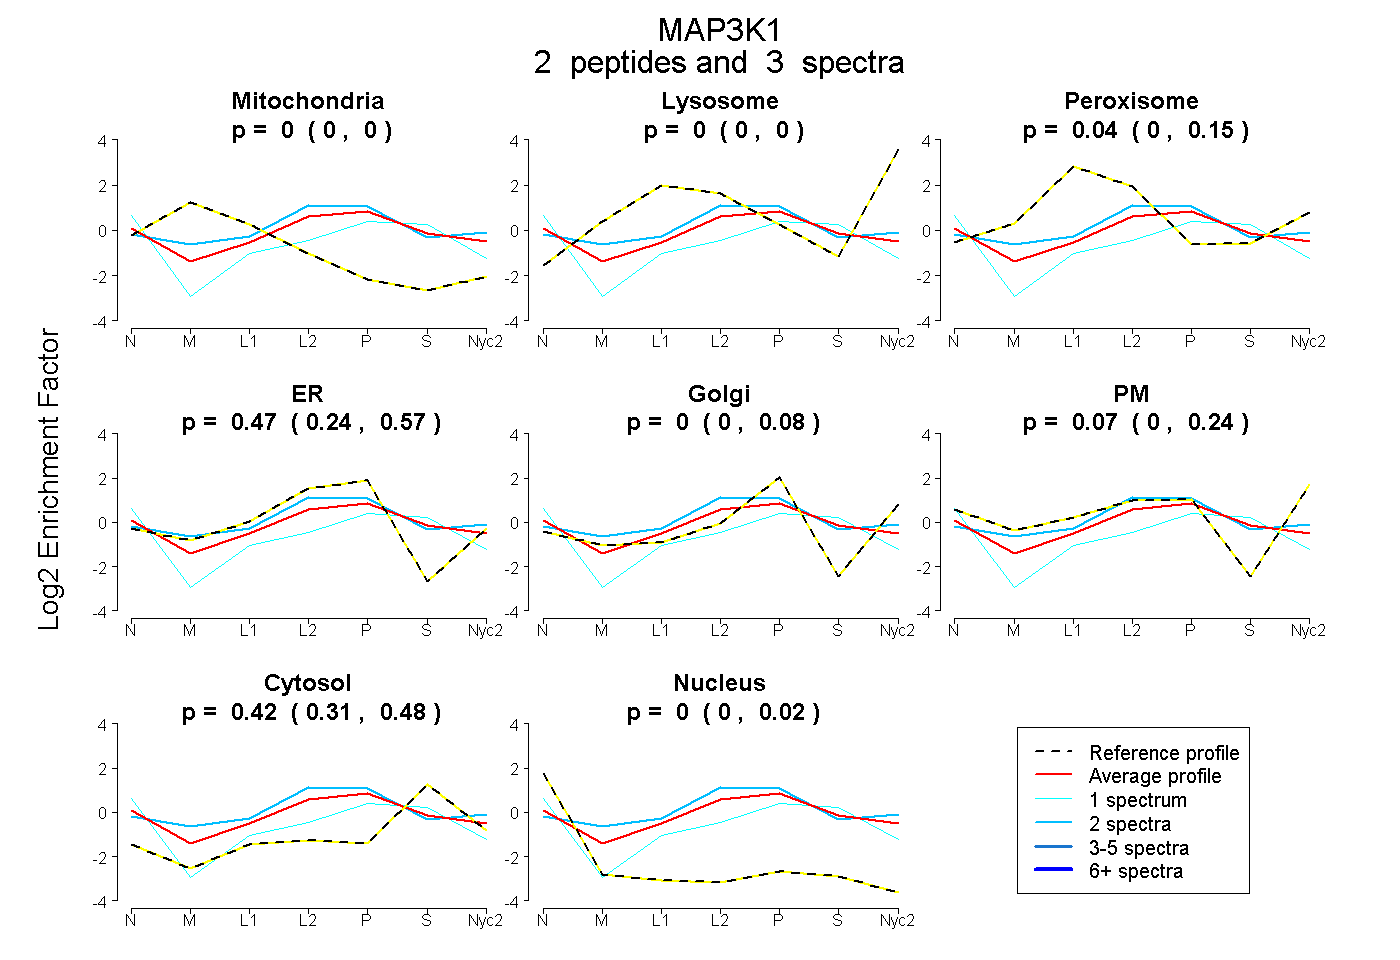
| Plot | Mito | Lyso | Perox | ER | Golgi | PM | Cytosol | Nucleus | |||||
| Expt A |
2 peptides |
3 spectra |
|
0.000 0.000 | 0.000 |
0.000 0.000 | 0.000 |
0.044 0.000 | 0.150 |
0.470 0.242 | 0.570 |
0.000 0.000 | 0.080 |
0.070 0.000 | 0.235 |
0.417 0.315 | 0.484 |
0.000 0.000 | 0.024 |