 3
3peptides
spectra
0.891 | 0.945
0.000 | 0.003
0.000 | 0.000
0.000 | 0.000
0.000 | 0.025
0.000 | 0.000
0.000 | 0.047
0.029 | 0.083
| Plot | Mito | Lyso | Perox | ER | Golgi | PM | Cytosol | Nucleus | |||||
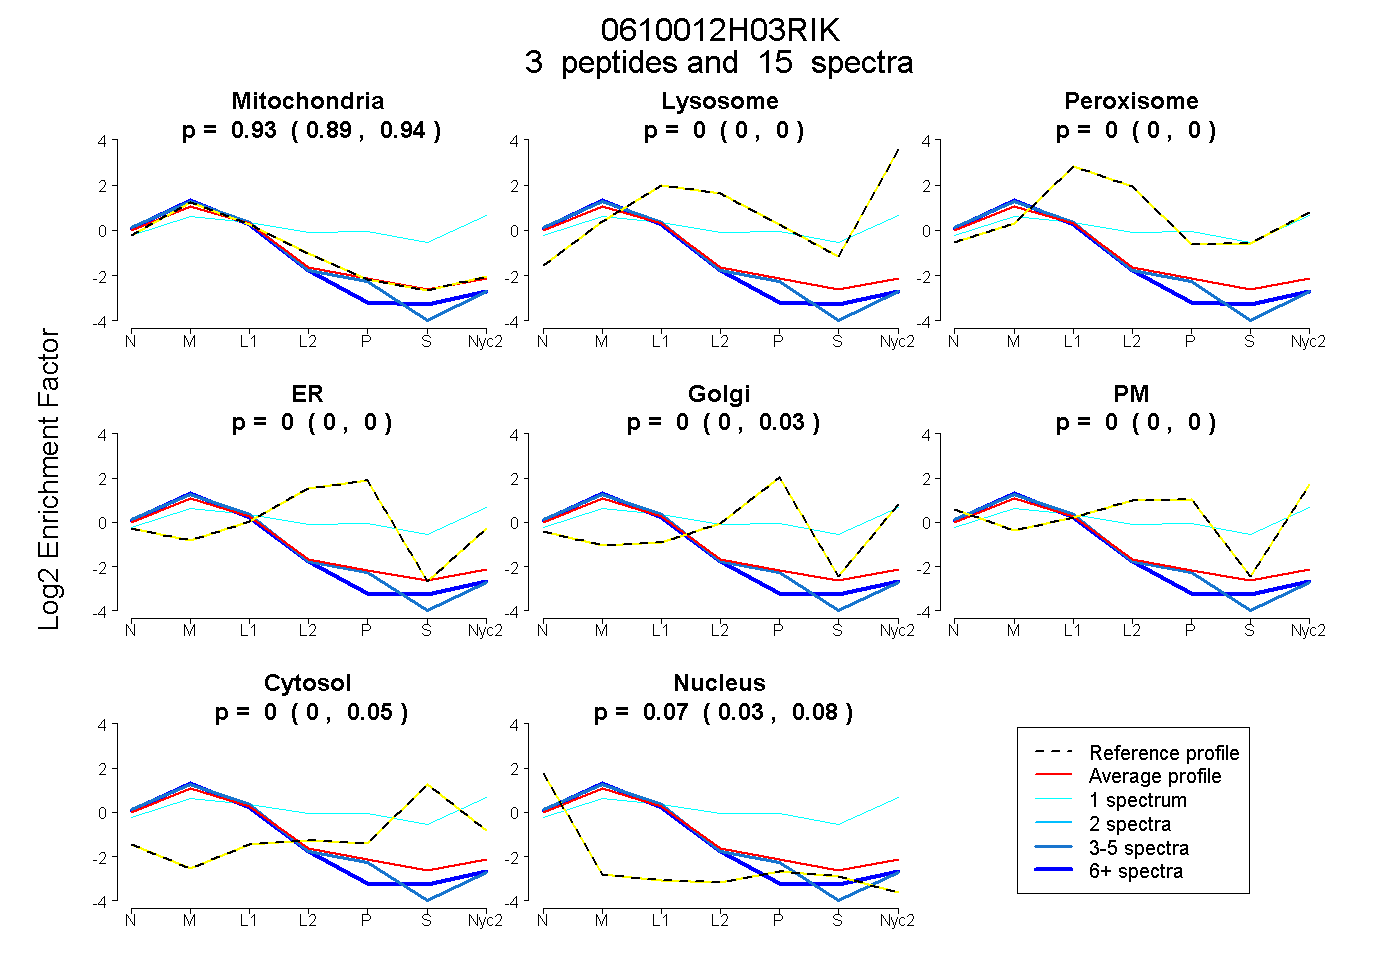
| Expt A |
3 peptides |
15 spectra |
|
0.934 0.891 | 0.945 |
0.000 0.000 | 0.003 |
0.000 0.000 | 0.000 |
0.000 0.000 | 0.000 |
0.000 0.000 | 0.025 |
0.000 0.000 | 0.000 |
0.000 0.000 | 0.047 |
0.066 0.029 | 0.083 |
| 10 spectra, YFLPIQTR | 0.904 | 0.000 | 0.000 | 0.000 | 0.000 | 0.000 | 0.000 | 0.096 | ||
| 4 spectra, YHTPIGFPQVPLAALAVEK | 0.916 | 0.000 | 0.000 | 0.000 | 0.000 | 0.000 | 0.000 | 0.084 | ||
| 1 spectrum, QLEAYR | 0.235 | 0.227 | 0.097 | 0.000 | 0.041 | 0.202 | 0.197 | 0.000 |
| Plot | Mito | Lyso or Perox | ER | Golgi | PM | Cytosol | Nucleus | ||||||
| Expt B |
2 peptides |
7 spectra |
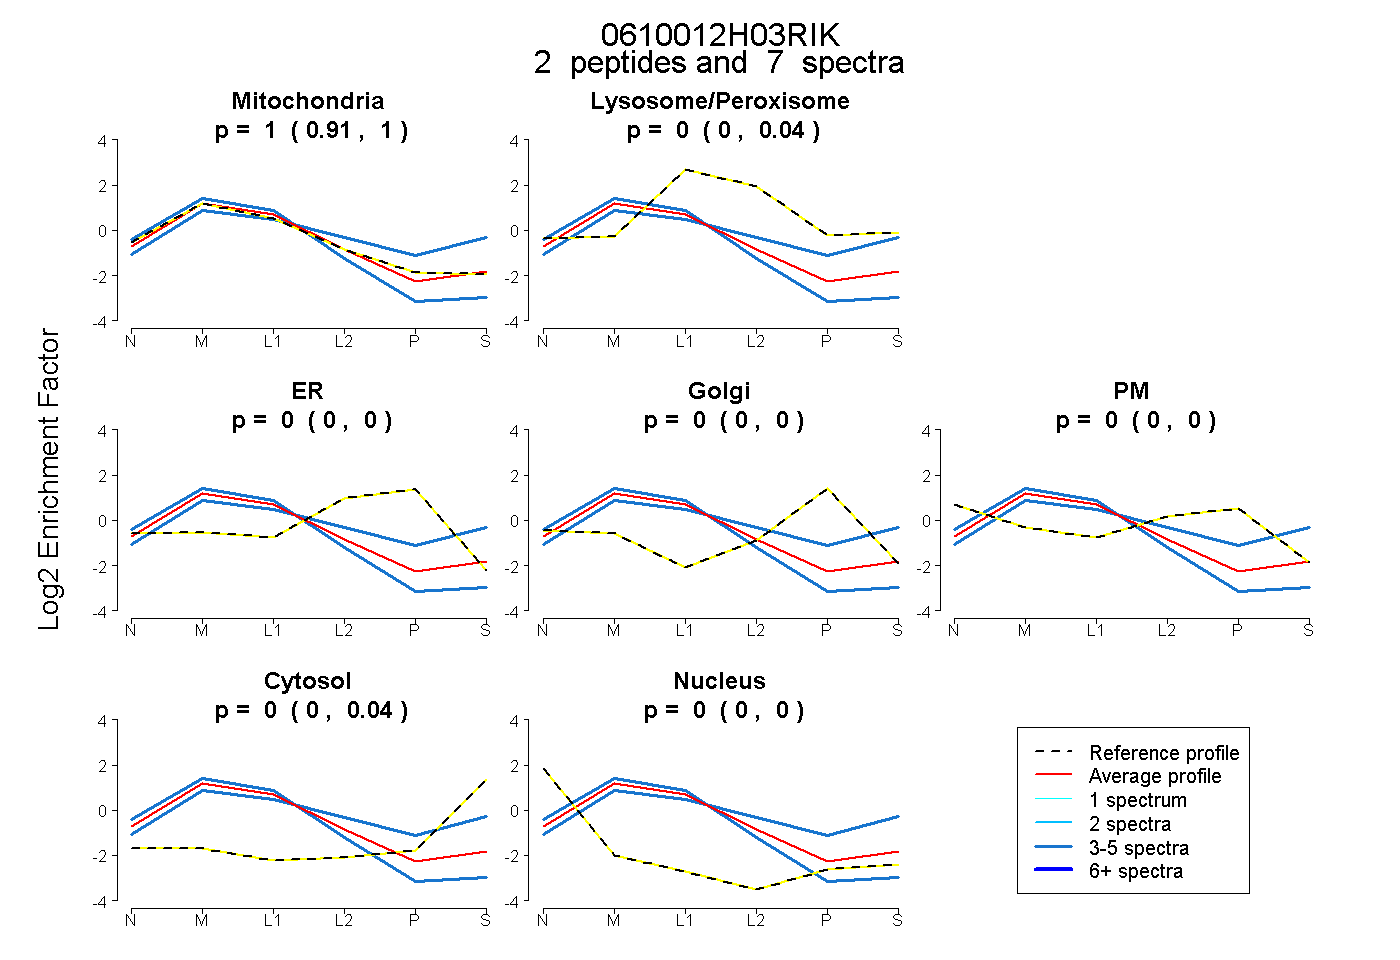 |
0.995 0.914 | 1.000 |
0.000 0.000 | 0.036 |
0.000 0.000 | 0.000 |
0.000 0.000 | 0.000 |
0.000 0.000 | 0.000 |
0.005 0.000 | 0.042 |
0.000 0.000 | 0.000 |
|||
| Plot | Lyso | Other | |||||||||||
| Expt C |
4 peptides |
22 spectra |
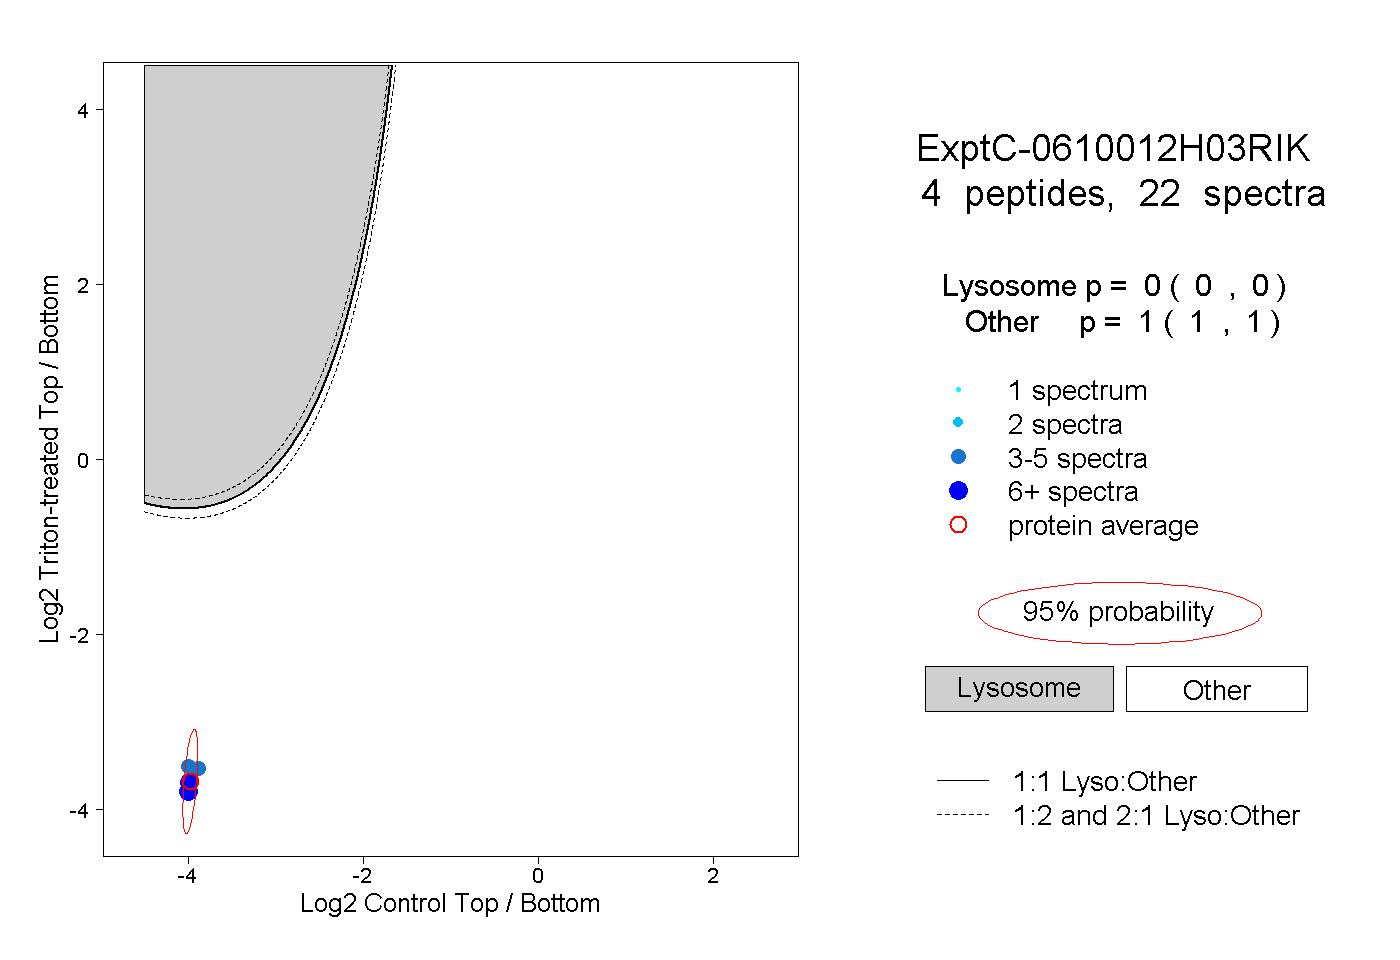 |
0.000 0.000 | 0.000 |
1.000 1.000 | 1.000 |
||||||||
| Plot | Lyso | Other | |||||||||||
| Expt D |
2 peptides |
2 spectra |
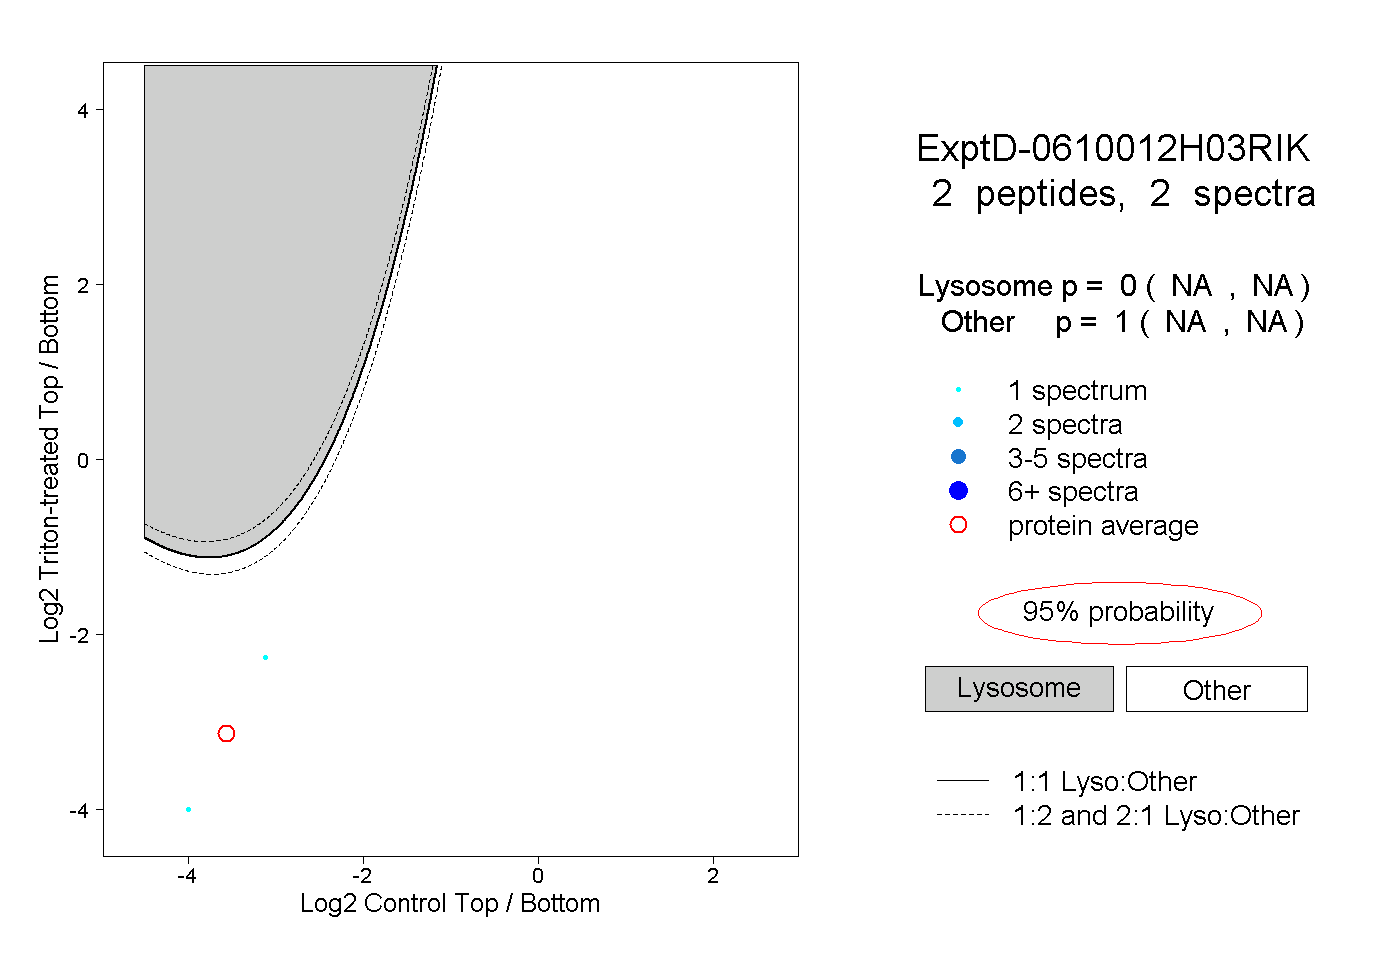 |
0.000 NA | NA |
1.000 NA | NA |