 3
3peptides
spectra
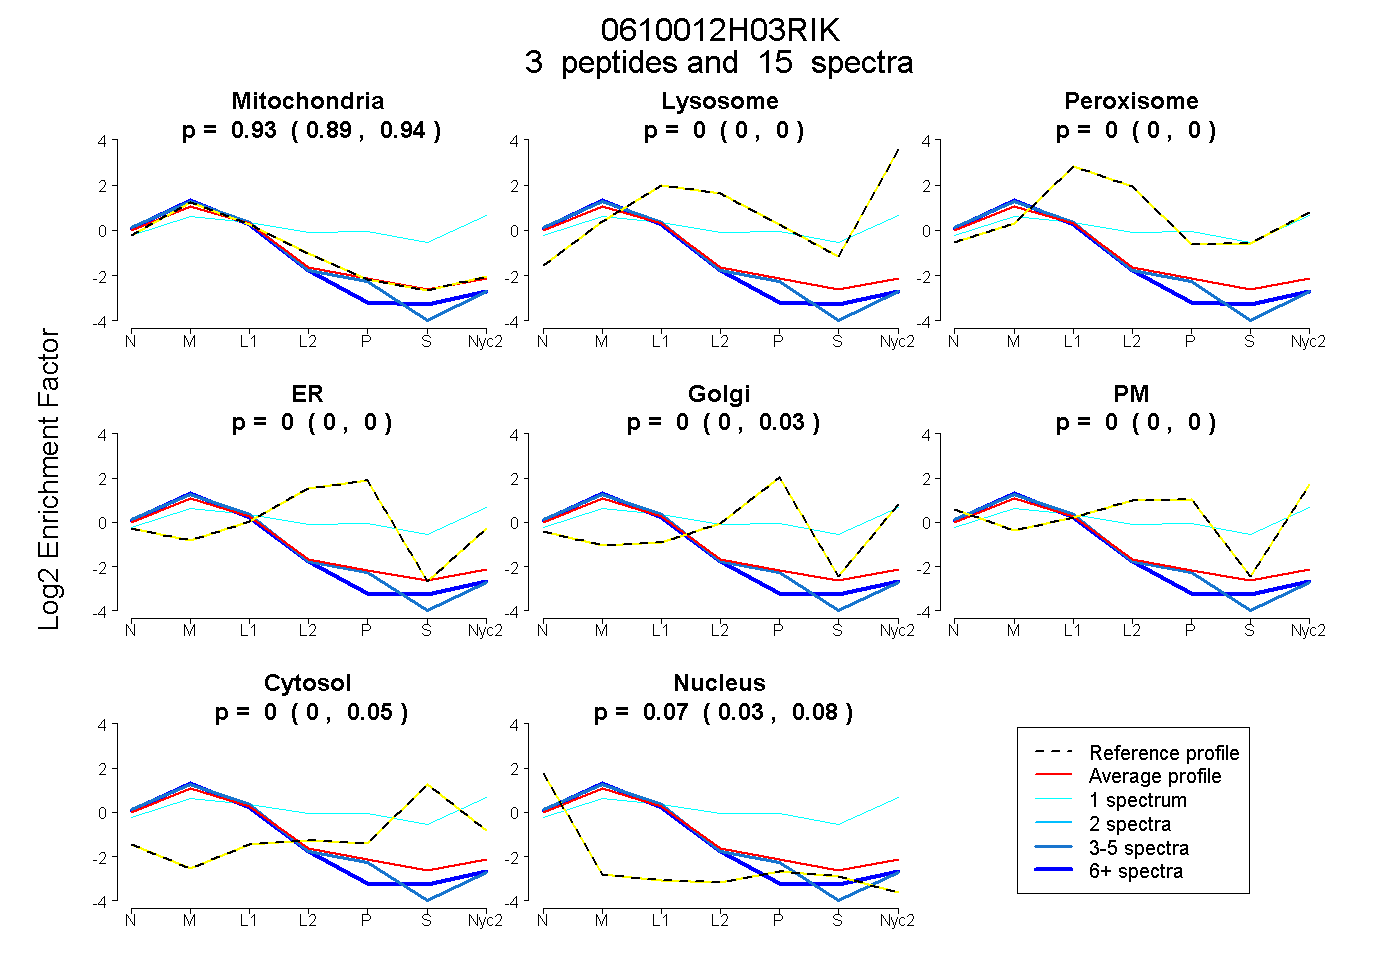
0.891 | 0.945
0.000 | 0.003
0.000 | 0.000
0.000 | 0.000
0.000 | 0.025
0.000 | 0.000
0.000 | 0.047
0.029 | 0.083
2peptides
spectra
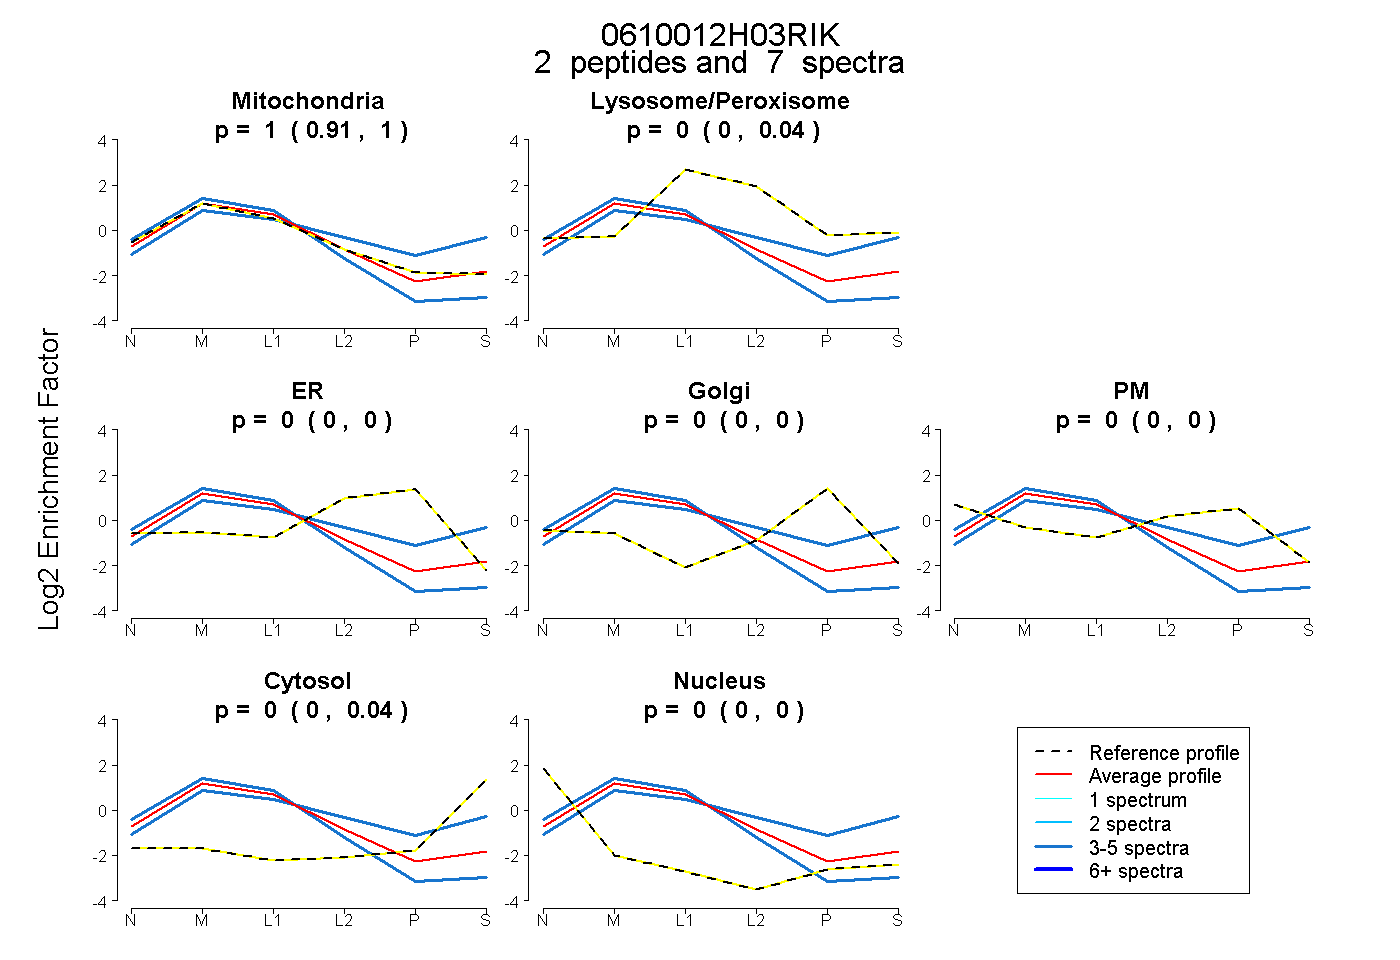
0.914 | 1.000
0.000 | 0.036
0.000 | 0.000
0.000 | 0.000
0.000 | 0.000
0.000 | 0.042
0.000 | 0.000
4peptides
spectra
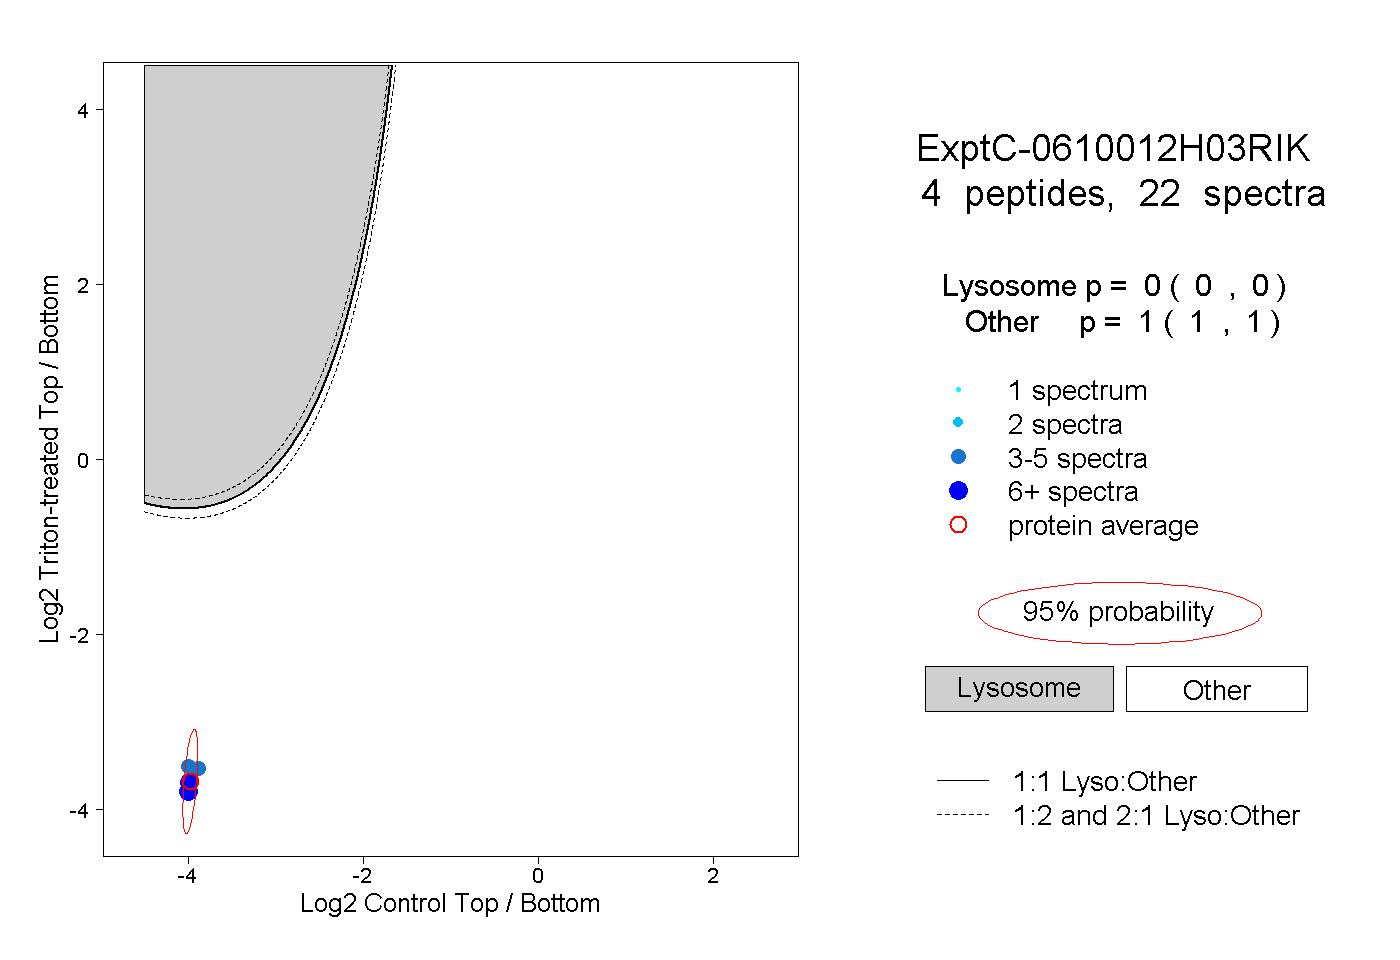
0.000 | 0.000
1.000 | 1.000
2peptides
spectra
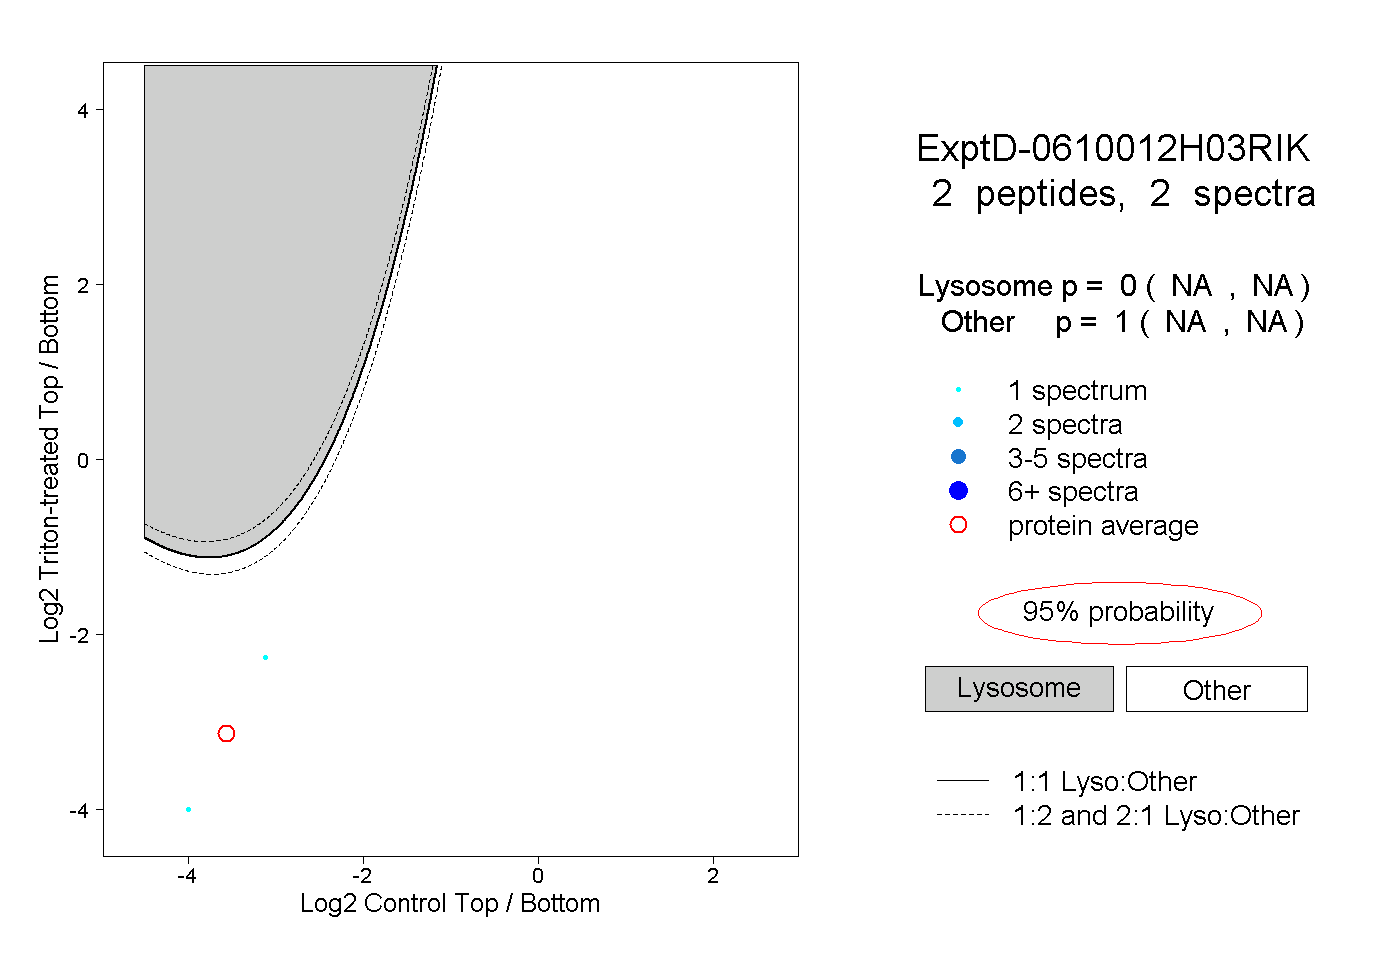
NA | NA
NA | NA