 11
11peptides
spectra
0.000 | 0.000
0.000 | 0.000
0.000 | 0.000
0.084 | 0.120
0.219 | 0.255
0.178 | 0.215
0.435 | 0.451
0.010 | 0.021
2peptides
spectra
NA | NA
NA | NA
NA | NA
NA | NA
NA | NA
NA | NA
NA | NA
| Plot | Mito | Lyso | Perox | ER | Golgi | PM | Cytosol | Nucleus | |||||
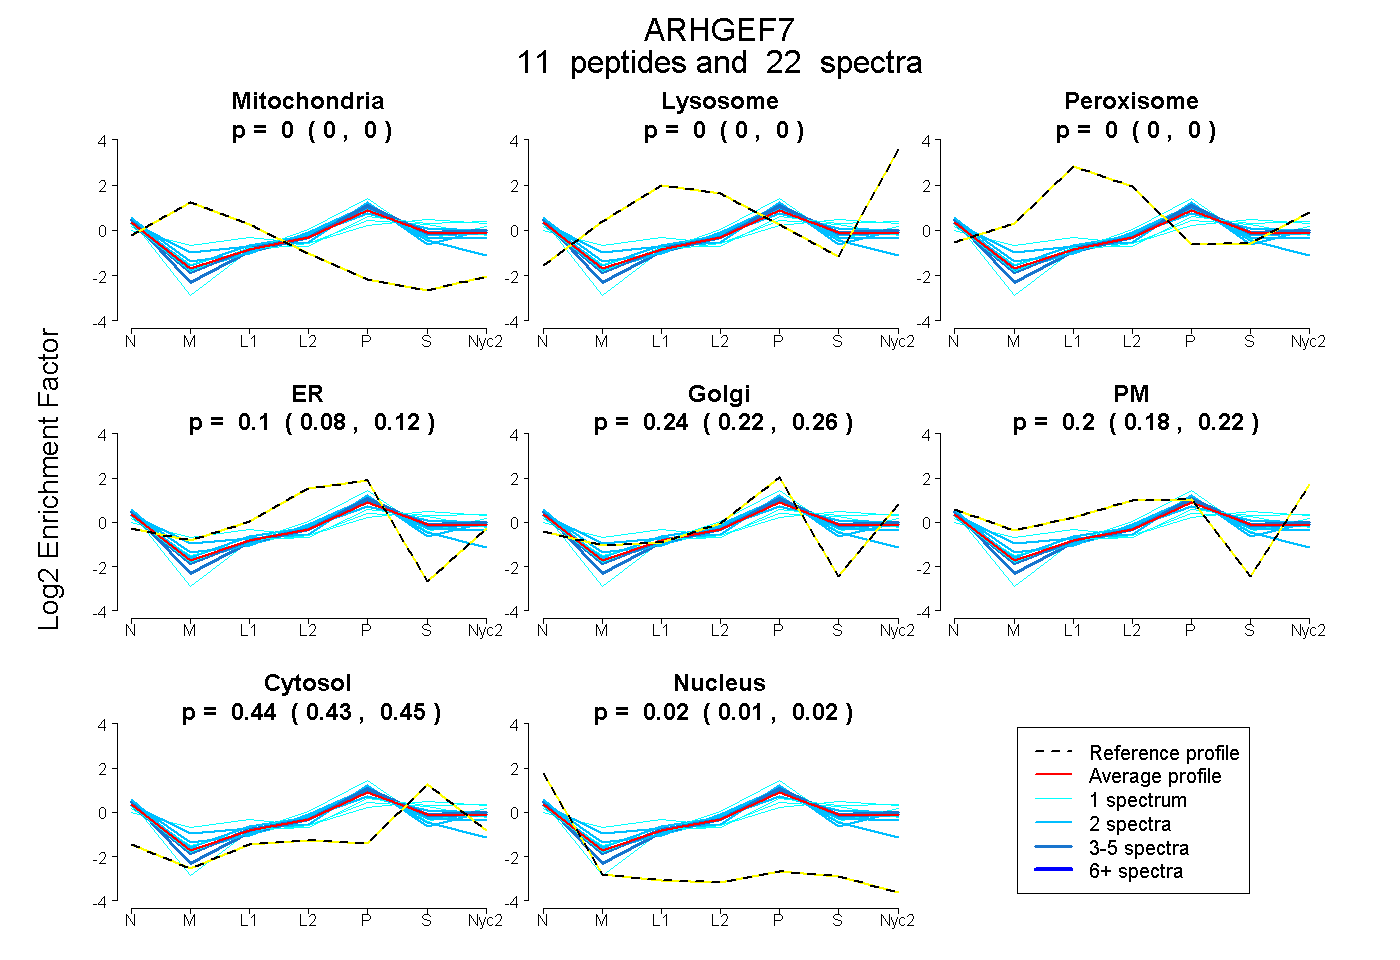
| Expt A |
11 peptides |
22 spectra |
|
0.000 0.000 | 0.000 |
0.000 0.000 | 0.000 |
0.000 0.000 | 0.000 |
0.104 0.084 | 0.120 |
0.239 0.219 | 0.255 |
0.199 0.178 | 0.215 |
0.443 0.435 | 0.451 |
0.016 0.010 | 0.021 |
||
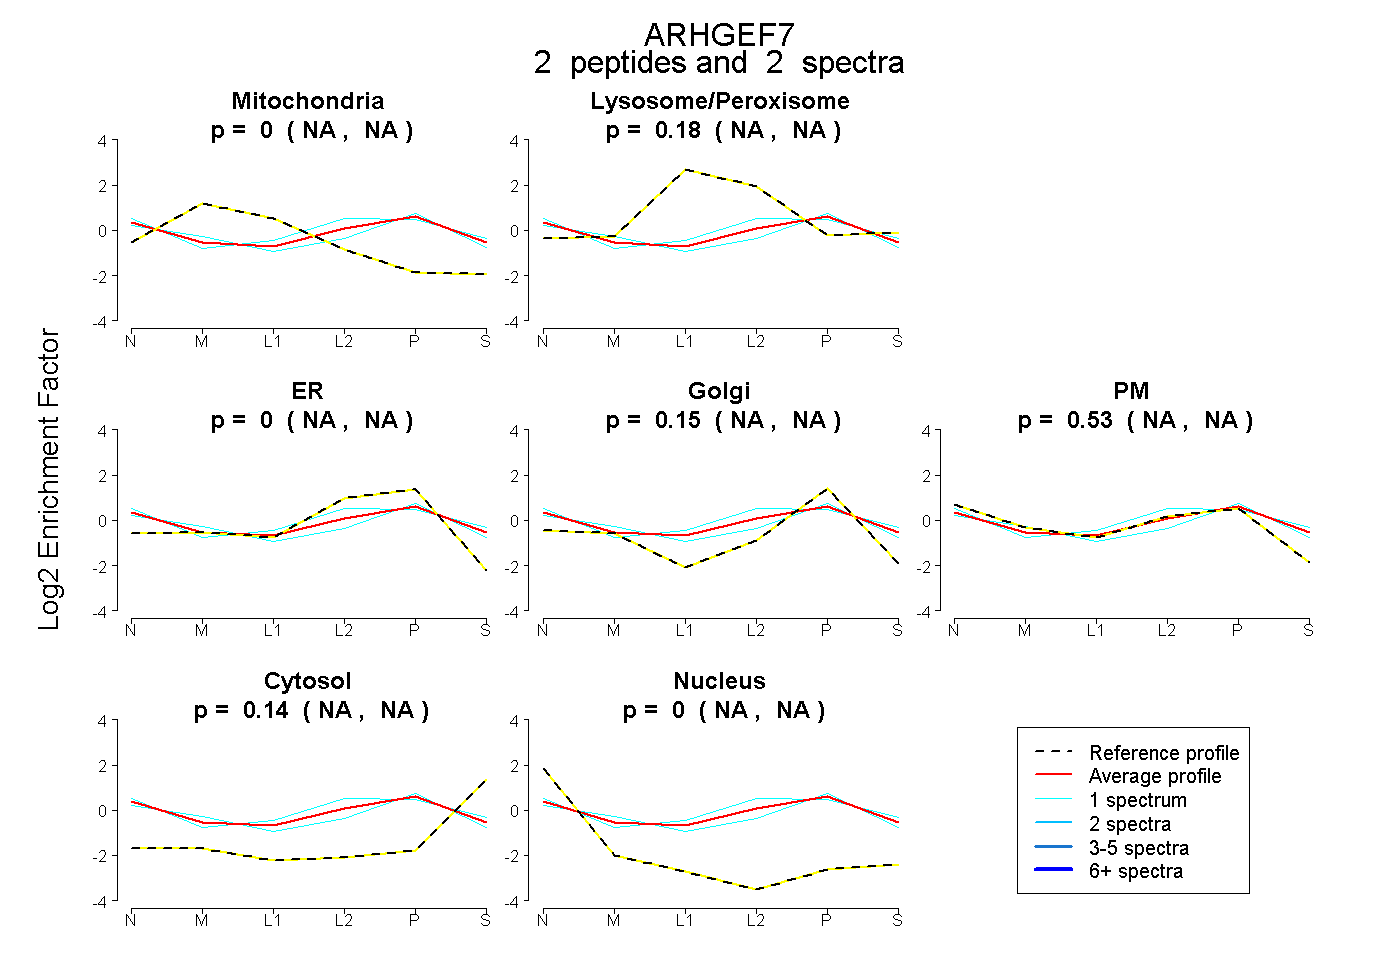
| Plot | Mito | Lyso or Perox | ER | Golgi | PM | Cytosol | Nucleus | ||||||
| Expt B |
2 peptides |
2 spectra |
|
0.000 NA | NA |
0.176 NA | NA |
0.000 NA | NA |
0.148 NA | NA |
0.533 NA | NA |
0.143 NA | NA |
0.000 NA | NA |
| 1 spectrum, EIKPSEKPVSPK | 0.000 | 0.124 | 0.000 | 0.305 | 0.438 | 0.133 | 0.000 | |||
| 1 spectrum, NLSAQCQEVR | 0.000 | 0.231 | 0.000 | 0.000 | 0.618 | 0.151 | 0.000 |
| Plot | Lyso | Other | |||||||||||
| Expt C |
2 peptides |
3 spectra |
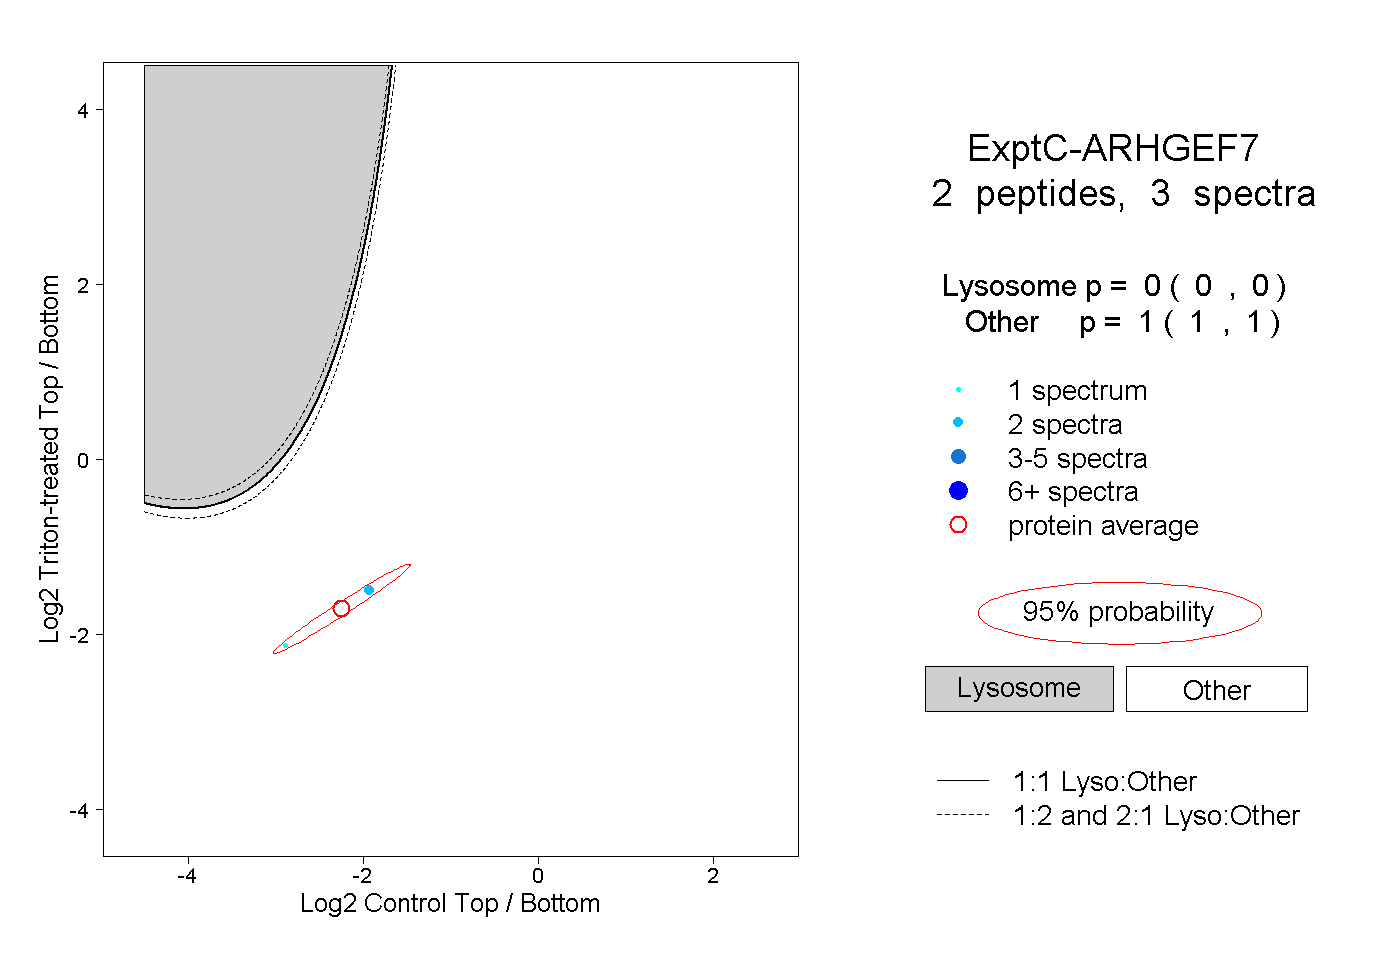 |
0.000 0.000 | 0.000 |
1.000 1.000 | 1.000 |
||||||||
| Plot | Lyso | Other | |||||||||||
| Expt D |
1 peptide |
3 spectra |
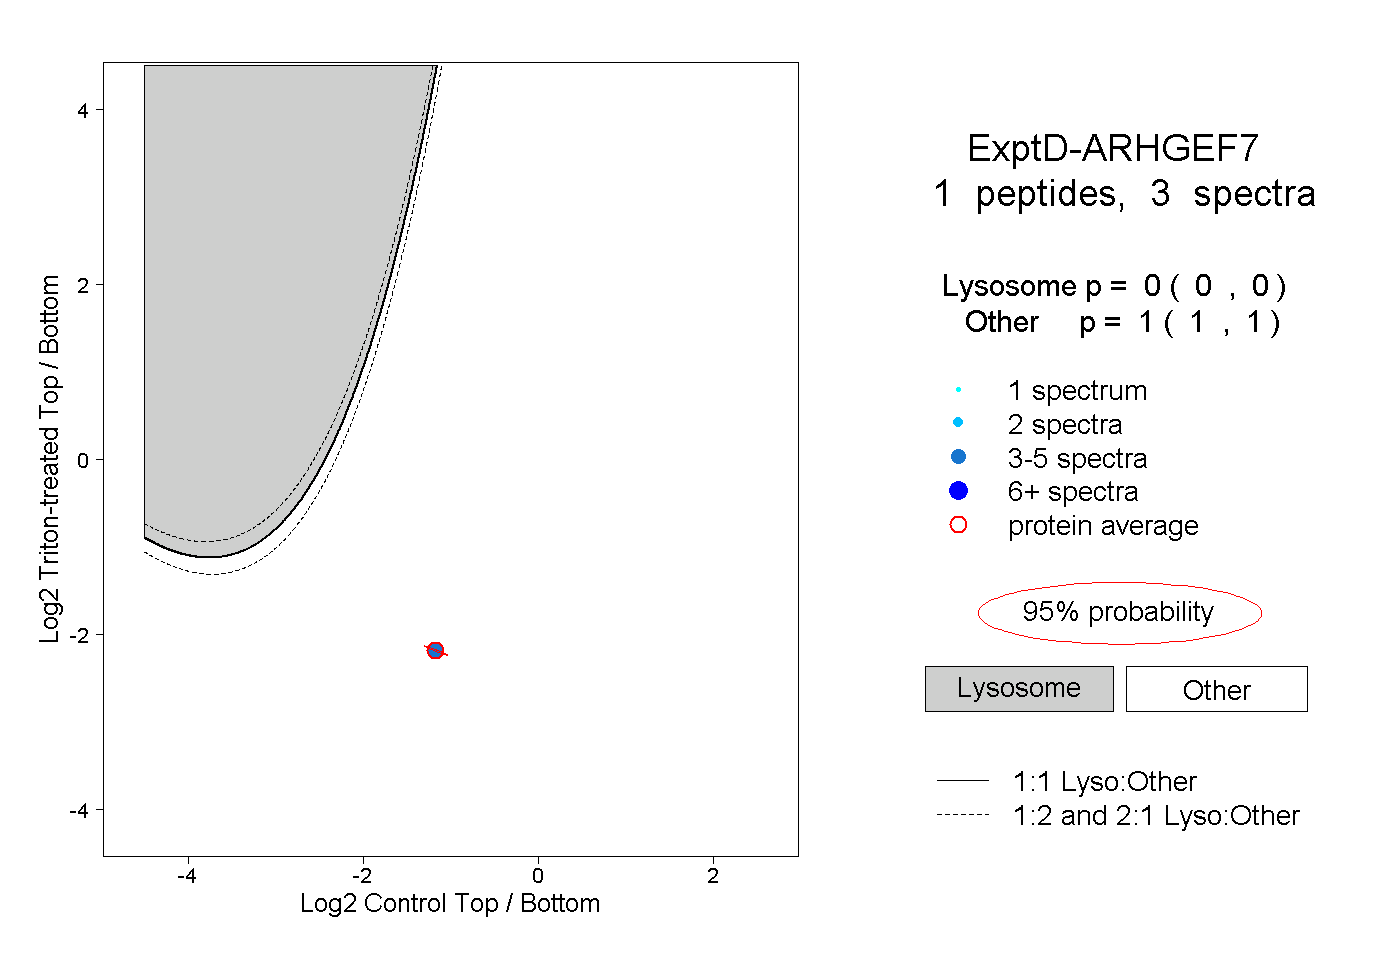 |
0.000 0.000 | 0.000 |
1.000 1.000 | 1.000 |