16
16peptides
spectra
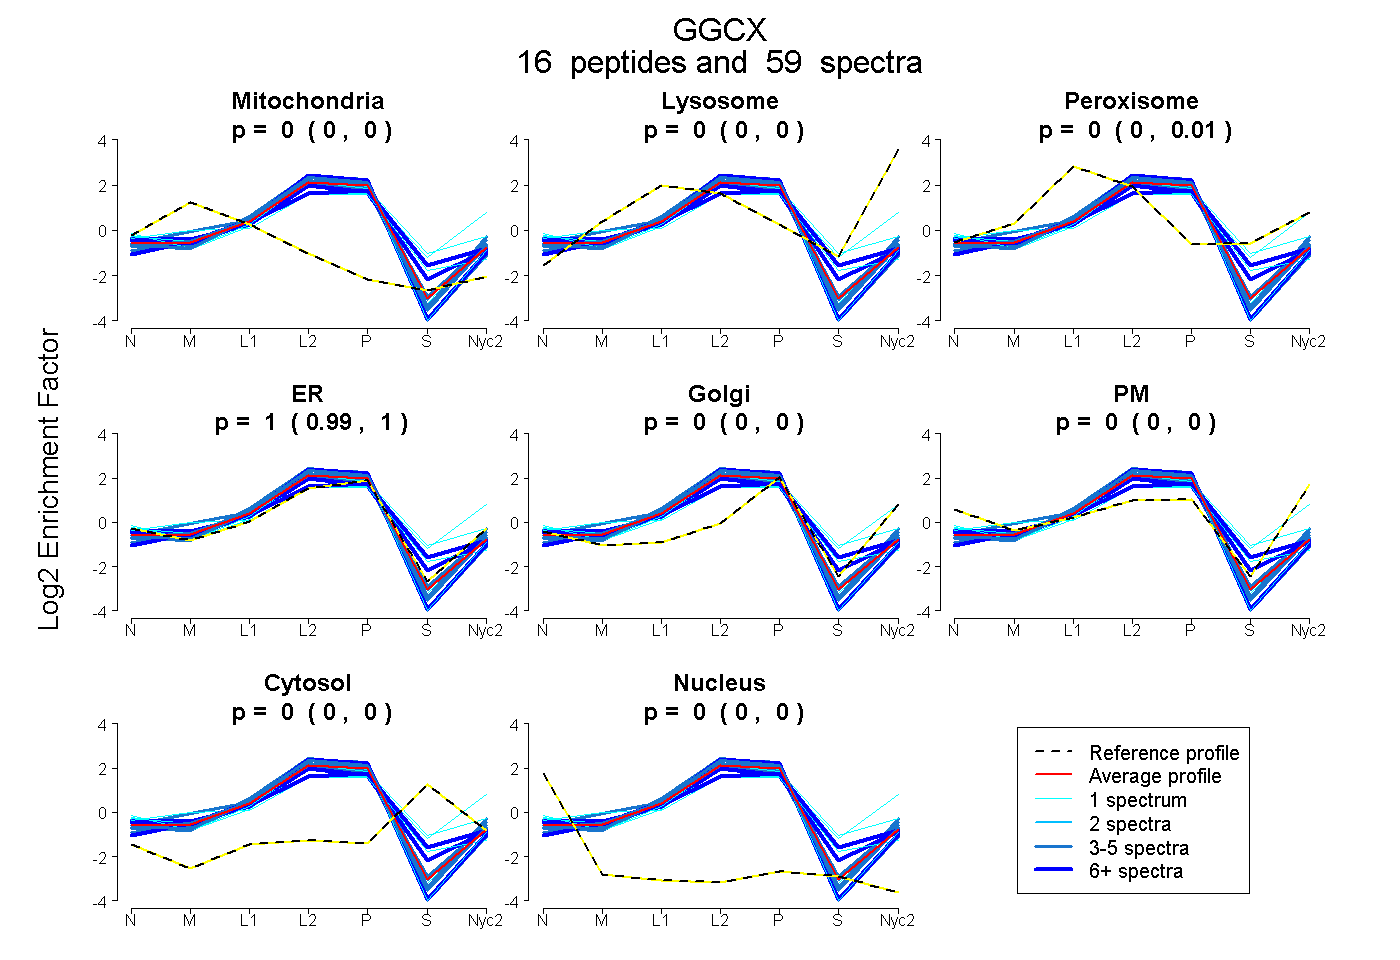
0.000 | 0.000
0.000 | 0.000
0.000 | 0.007
0.991 | 1.000
0.000 | 0.000
0.000 | 0.000
0.000 | 0.000
0.000 | 0.000
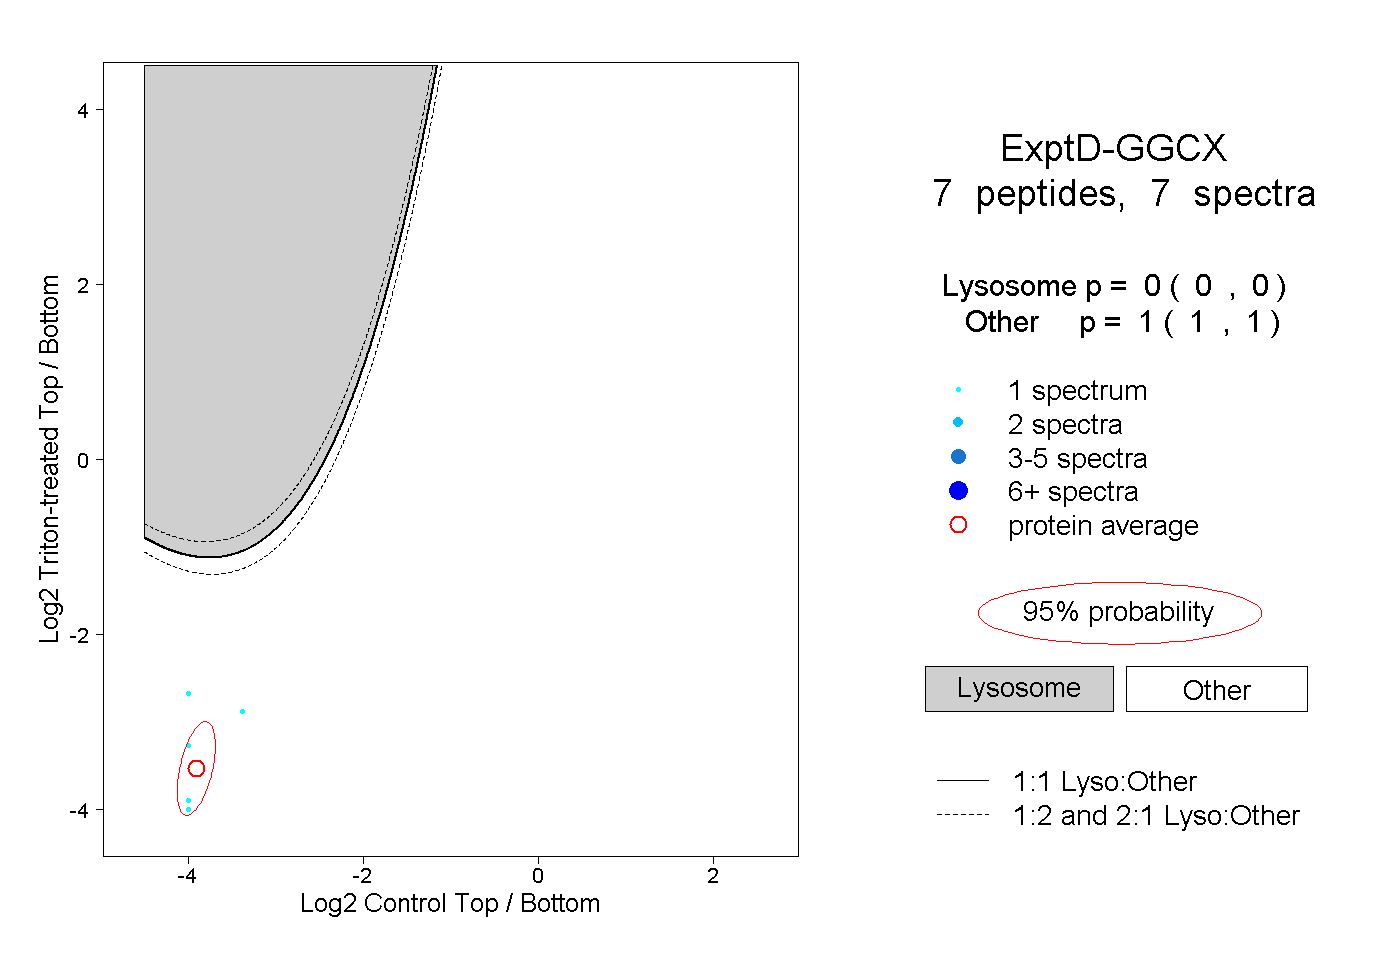
7peptides
spectra
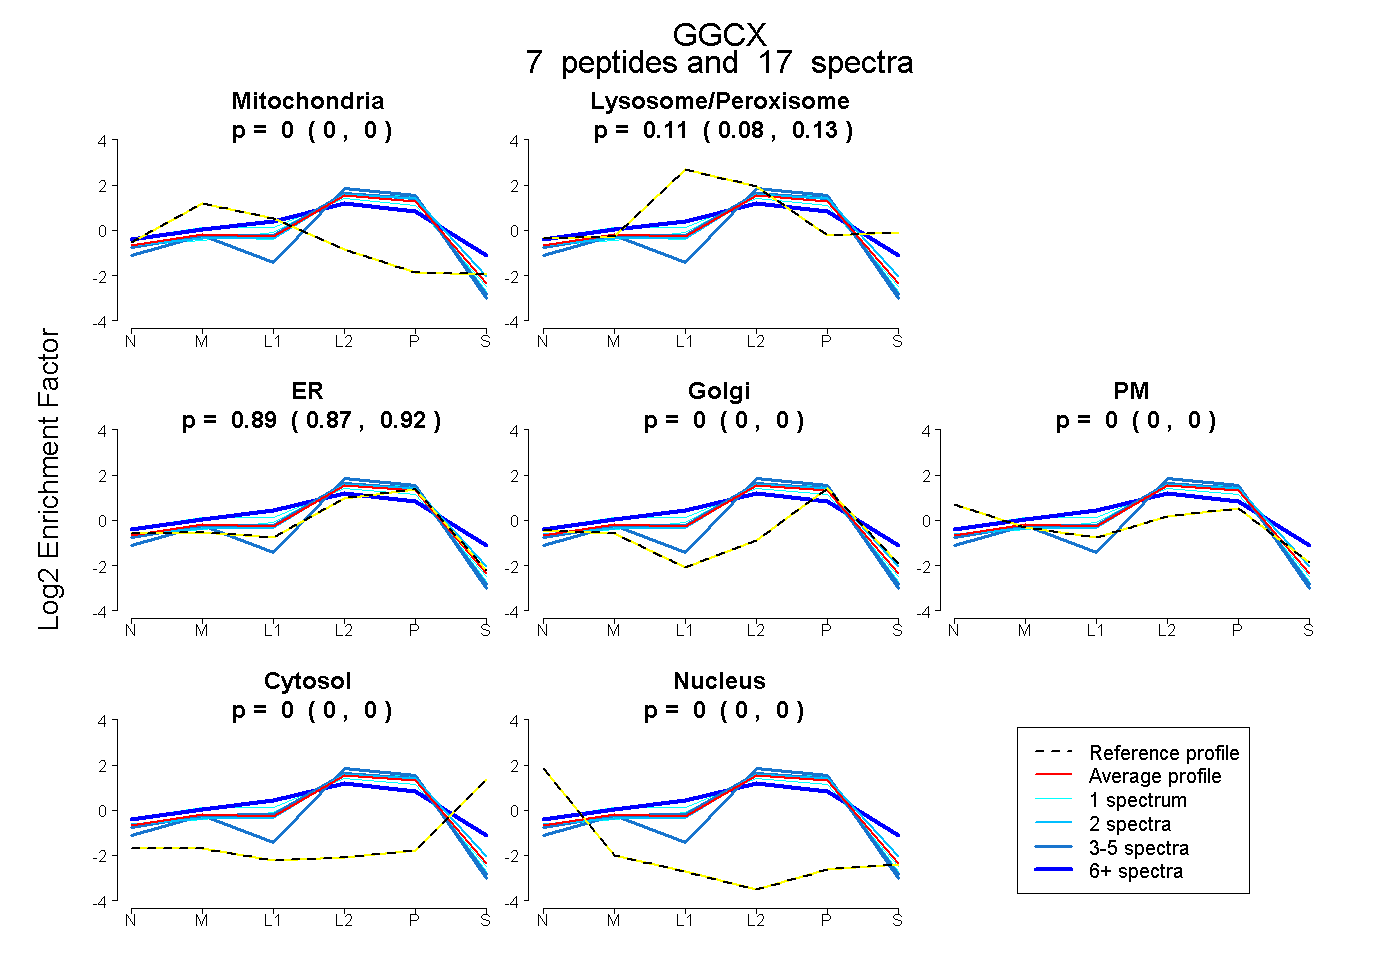
0.000 | 0.000
0.076 | 0.127
0.870 | 0.918
0.000 | 0.000
0.000 | 0.000
0.000 | 0.000
0.000 | 0.000
16peptides
spectra
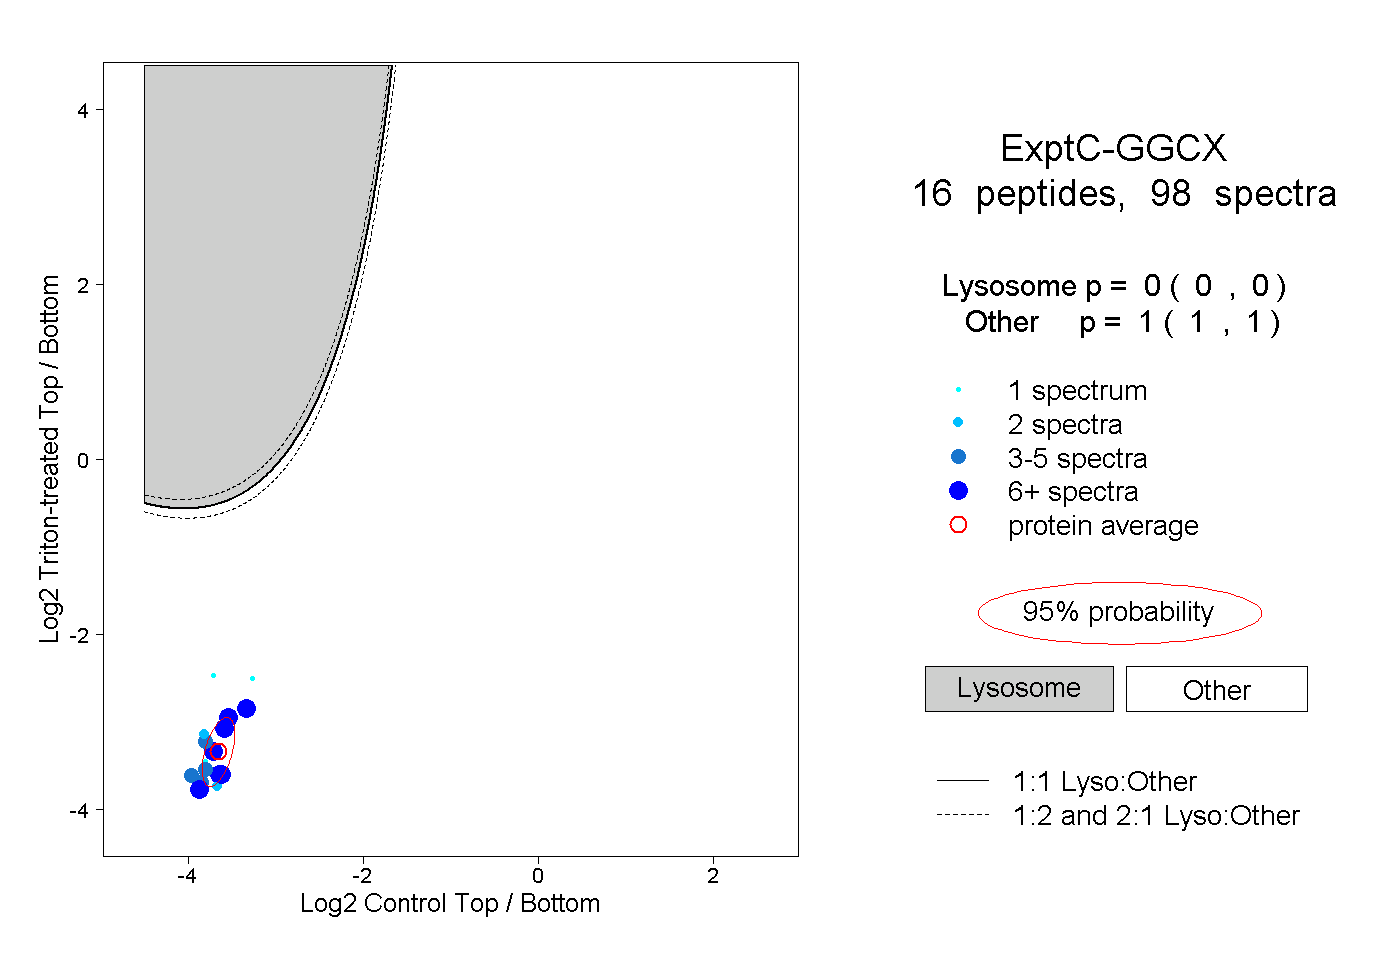
0.000 | 0.000
1.000 | 1.000