GGCX
[ENSRNOP00000017928]
Main page
| | | Plot |
Mito |
Lyso |
|
Perox |
ER |
Golgi |
PM |
Cytosol |
Nucleus |
|
| Expt A |
 16
16
peptides |
59
spectra |
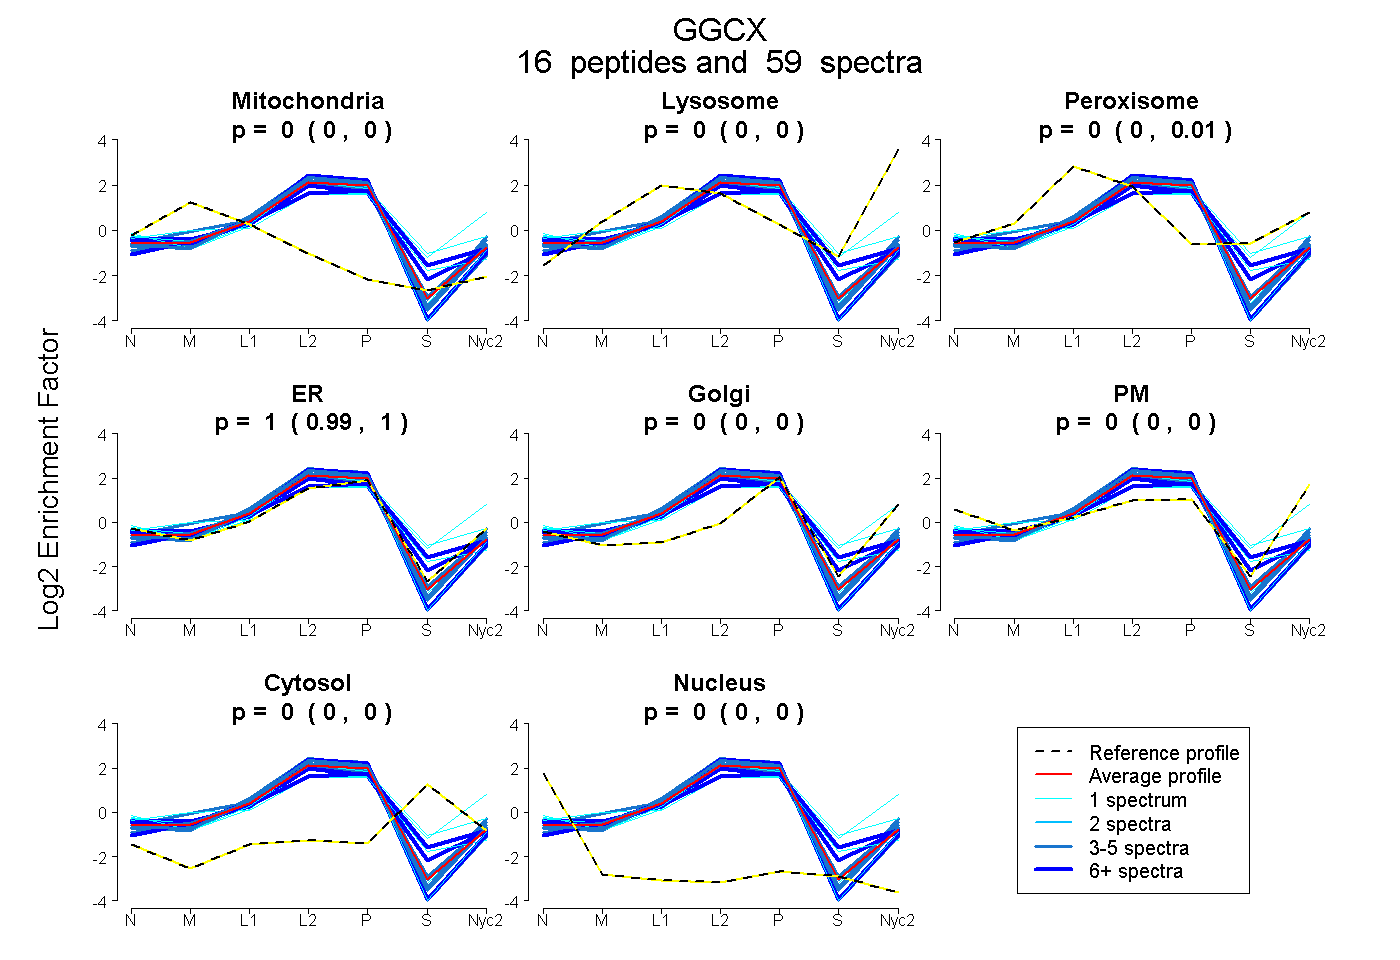 |
0.000
0.000 | 0.000 |
0.000
0.000 | 0.000 |
|
0.002
0.000 | 0.007 |
0.998
0.991 | 1.000 |
0.000
0.000 | 0.000 |
0.000
0.000 | 0.000 |
0.000
0.000 | 0.000 |
0.000
0.000 | 0.000 |
|
| | | Plot |
Mito |
|
Lyso or Perox |
|
ER |
Golgi |
PM |
Cytosol |
Nucleus |
|
| Expt B |
7
peptides |
17
spectra |
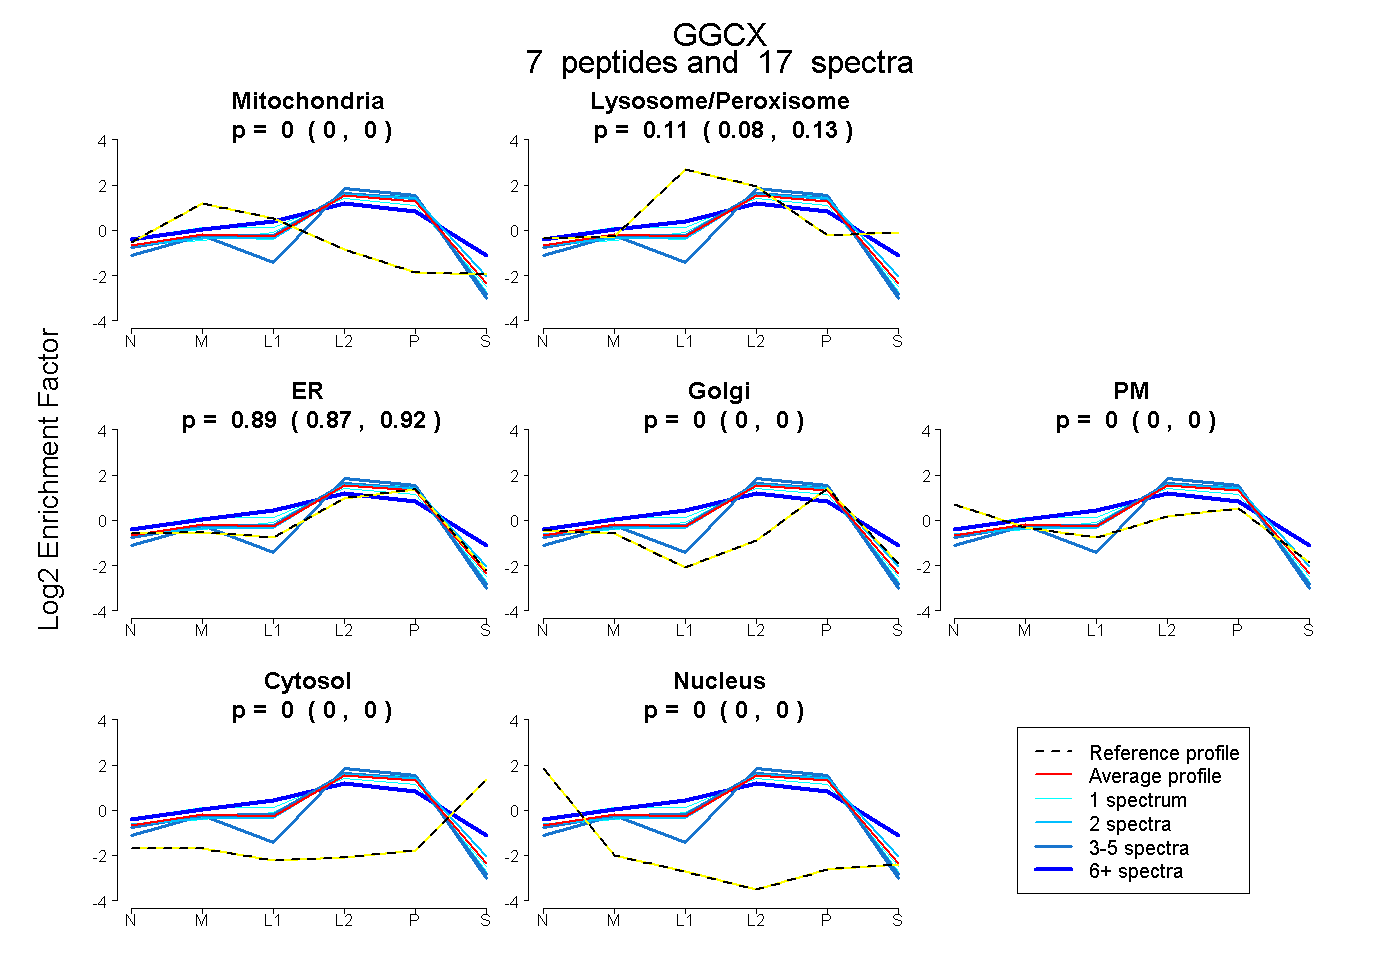 |
0.000
0.000 | 0.000 |
|
0.105
0.076 | 0.127 |
|
0.895
0.870 | 0.918 |
0.000
0.000 | 0.000 |
0.000
0.000 | 0.000 |
0.000
0.000 | 0.000 |
0.000
0.000 | 0.000 |
|
| 3 spectra, LYVFR |
0.000 |
|
0.059 |
|
0.941 |
0.000 |
0.000 |
0.000 |
0.000 |
|
| 1 spectrum, AAPRPSASCVYK |
0.050 |
|
0.158 |
|
0.792 |
0.000 |
0.000 |
0.000 |
0.000 |
|
| 1 spectrum, LQELLPAK |
0.000 |
|
0.038 |
|
0.962 |
0.000 |
0.000 |
0.000 |
0.000 |
|
| 6 spectra, HWLFSPFK |
0.012 |
|
0.414 |
|
0.421 |
0.130 |
0.022 |
0.000 |
0.000 |
|
| 1 spectrum, AGQKPGLR |
0.000 |
|
0.068 |
|
0.932 |
0.000 |
0.000 |
0.000 |
0.000 |
|
| 2 spectra, YLDGLDVCR |
0.000 |
|
0.120 |
|
0.880 |
0.000 |
0.000 |
0.000 |
0.000 |
|
| 3 spectra, SFLMTR |
0.000 |
|
0.000 |
|
1.000 |
0.000 |
0.000 |
0.000 |
0.000 |
|
| | | Plot |
|
Lyso |
|
|
|
|
|
|
|
Other |
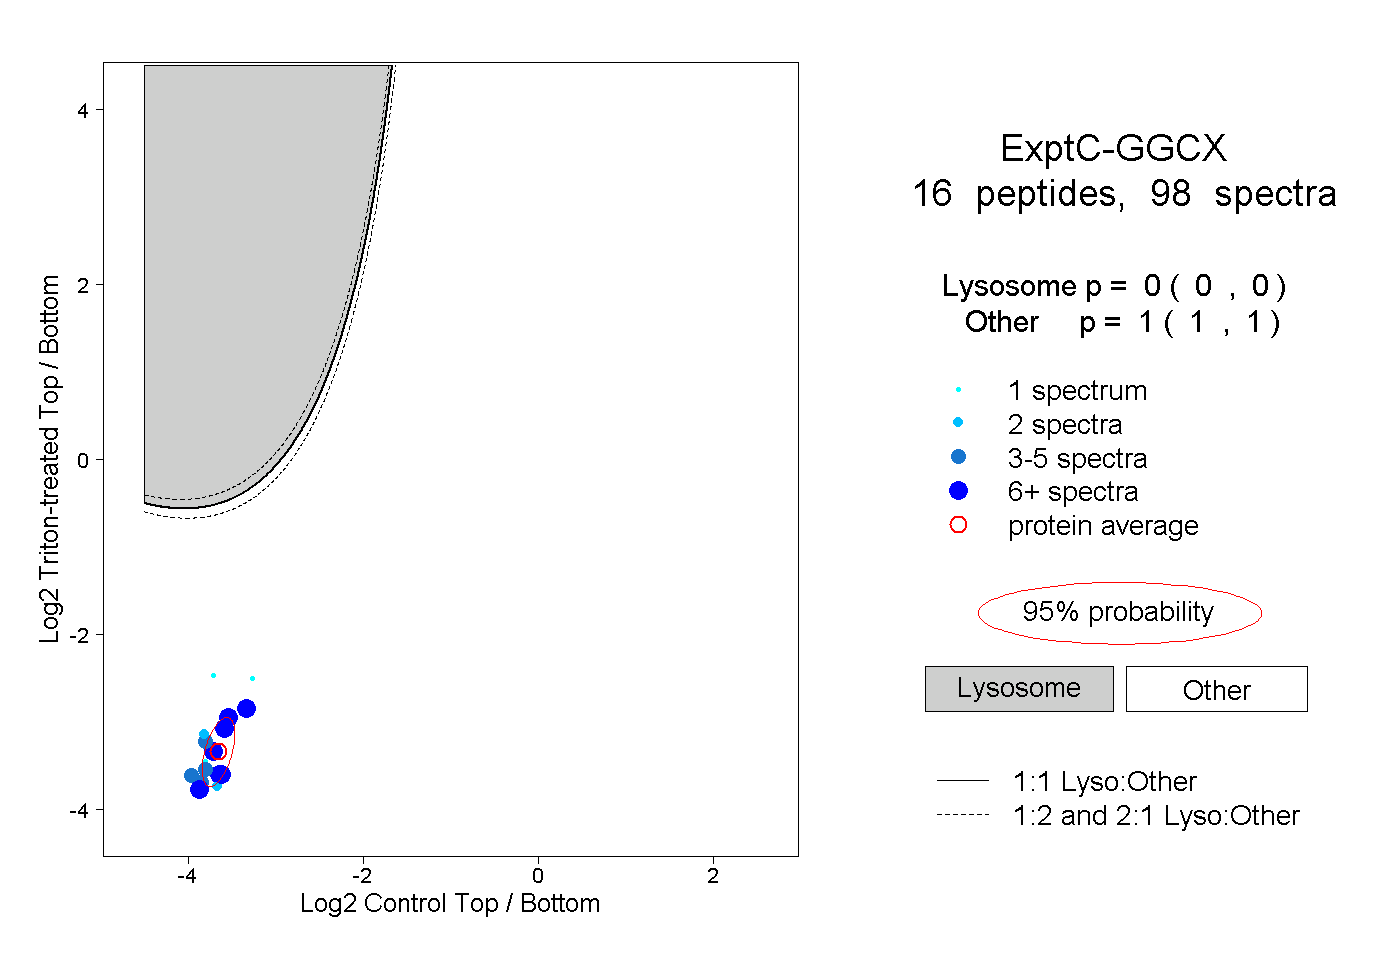
| Expt C |
16
peptides |
98
spectra |
 |
|
0.000
0.000 | 0.000 |
|
|
|
|
|
|
|
1.000
1.000 | 1.000 |
| | | Plot |
|
Lyso |
|
|
|
|
|
|
|
Other |
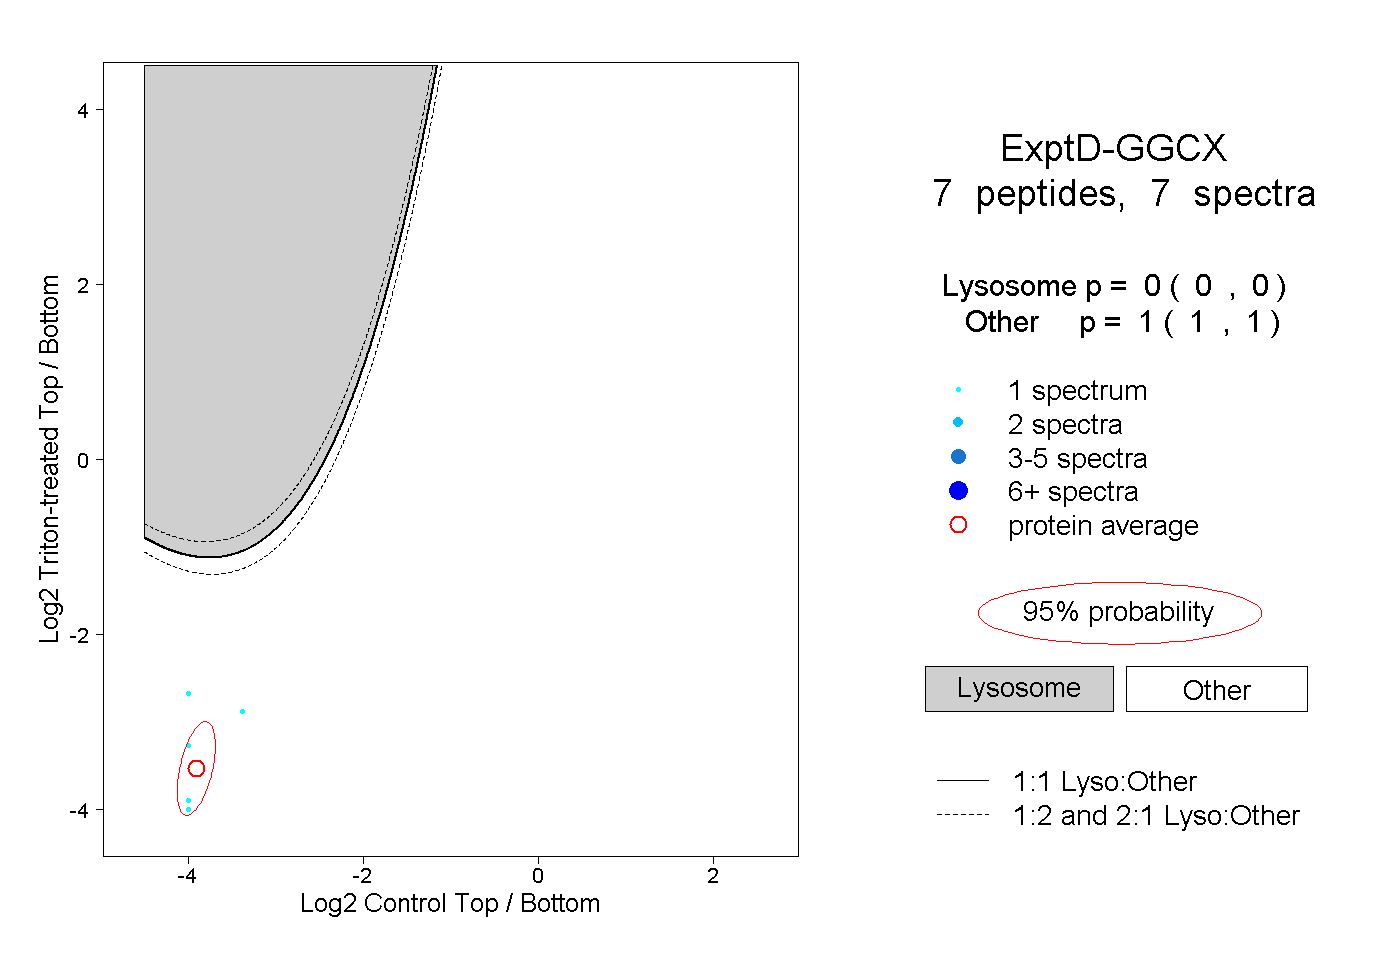
| Expt D |
7
peptides |
7
spectra |
 |
|
0.000
0.000 | 0.000 |
|
|
|
|
|
|
|
1.000
1.000 | 1.000 |