 3
3peptides
spectra
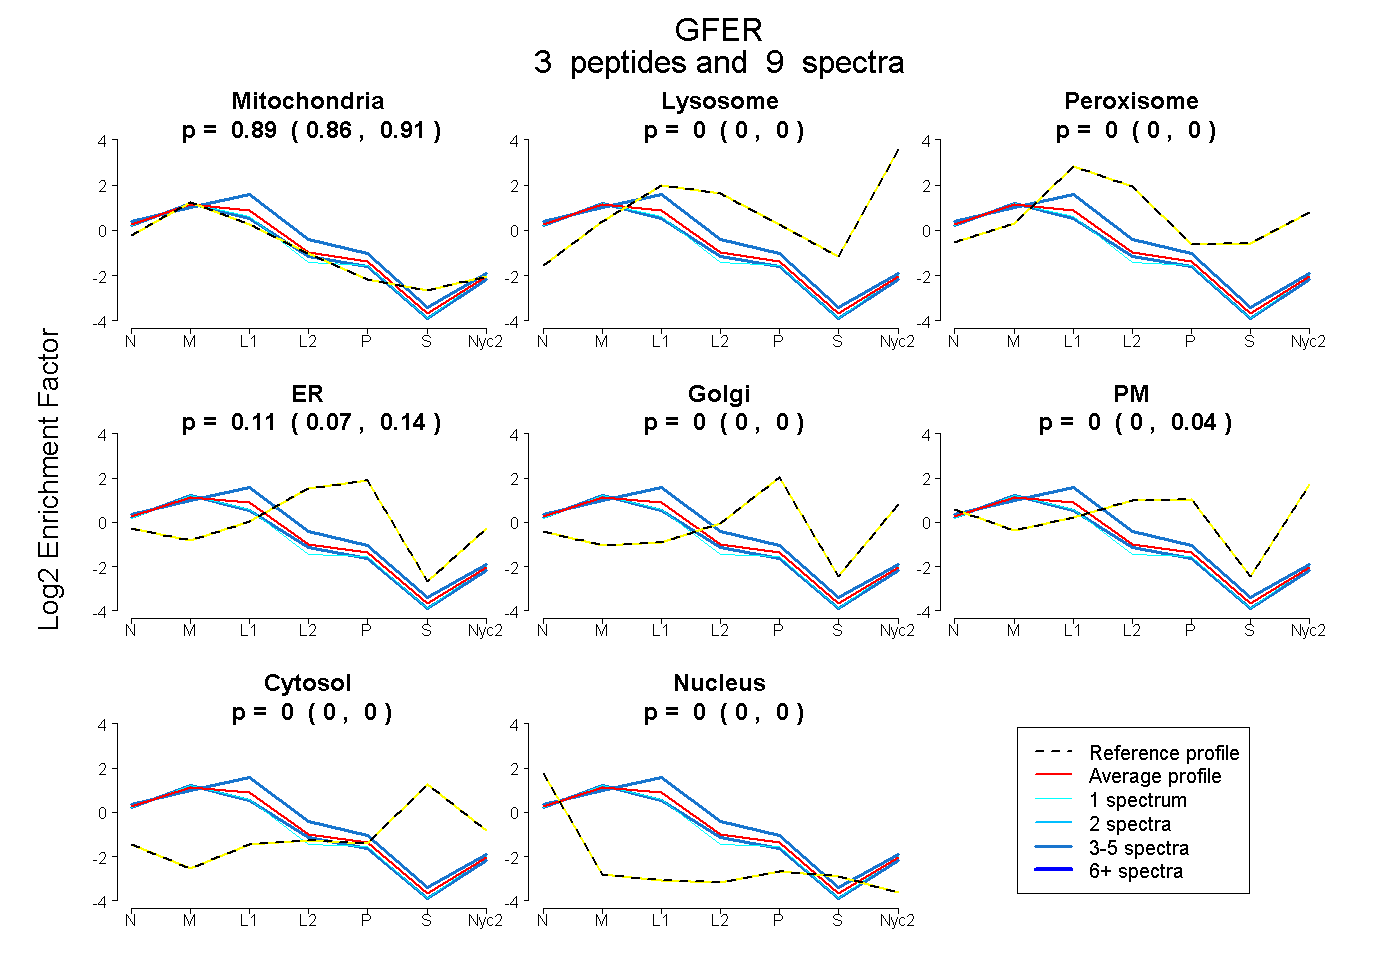
0.857 | 0.906
0.000 | 0.000
0.000 | 0.000
0.072 | 0.136
0.000 | 0.000
0.000 | 0.035
0.000 | 0.000
0.000 | 0.002
3peptides
spectra
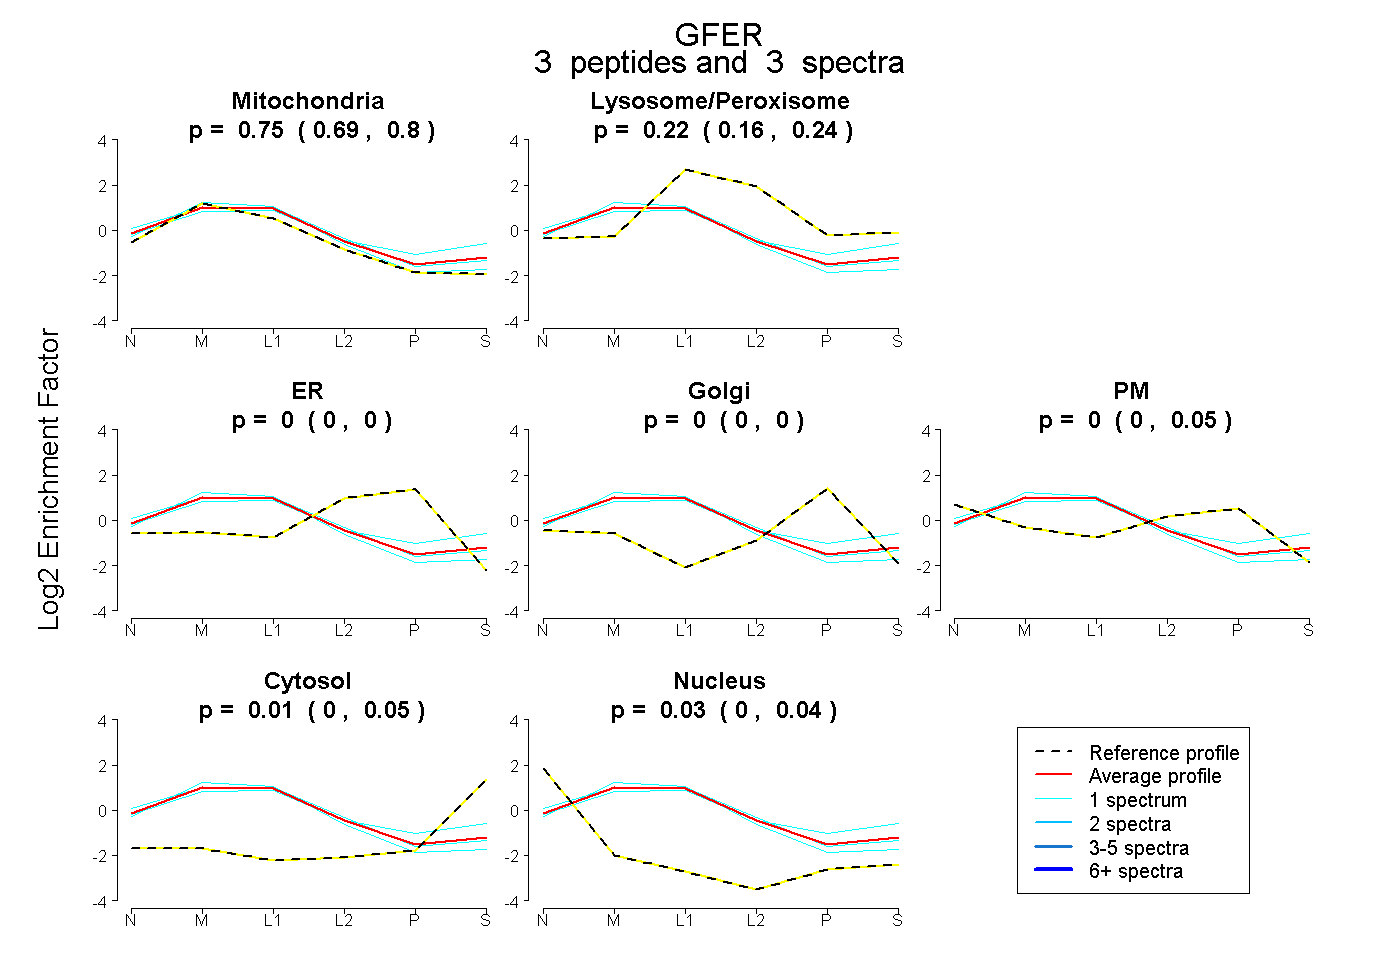
0.685 | 0.804
0.163 | 0.245
0.000 | 0.000
0.000 | 0.000
0.000 | 0.047
0.000 | 0.052
0.000 | 0.041
7peptides
spectra
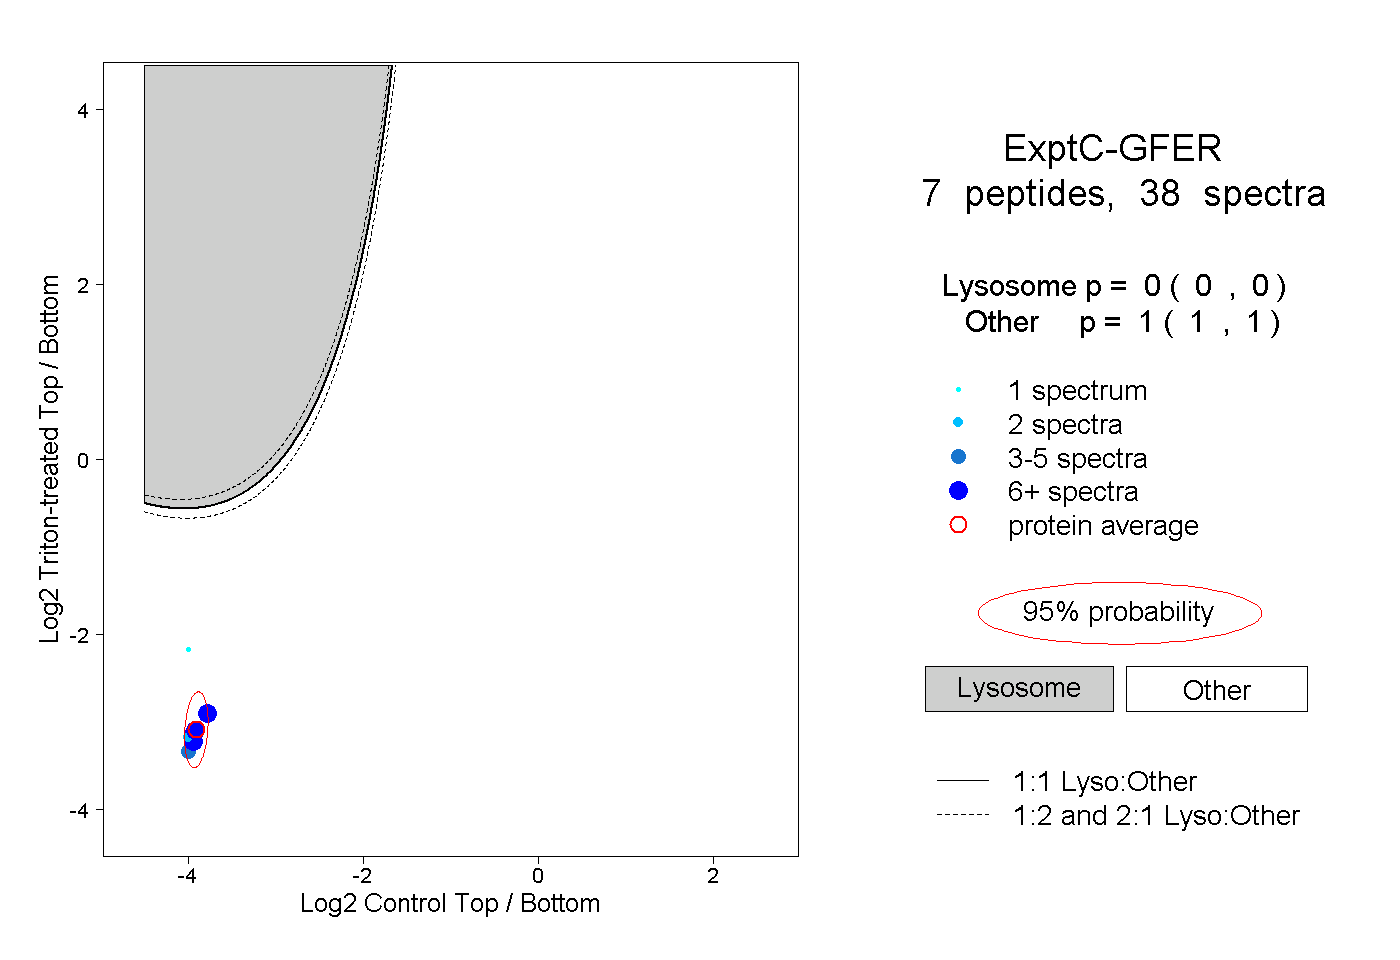
0.000 | 0.000
1.000 | 1.000