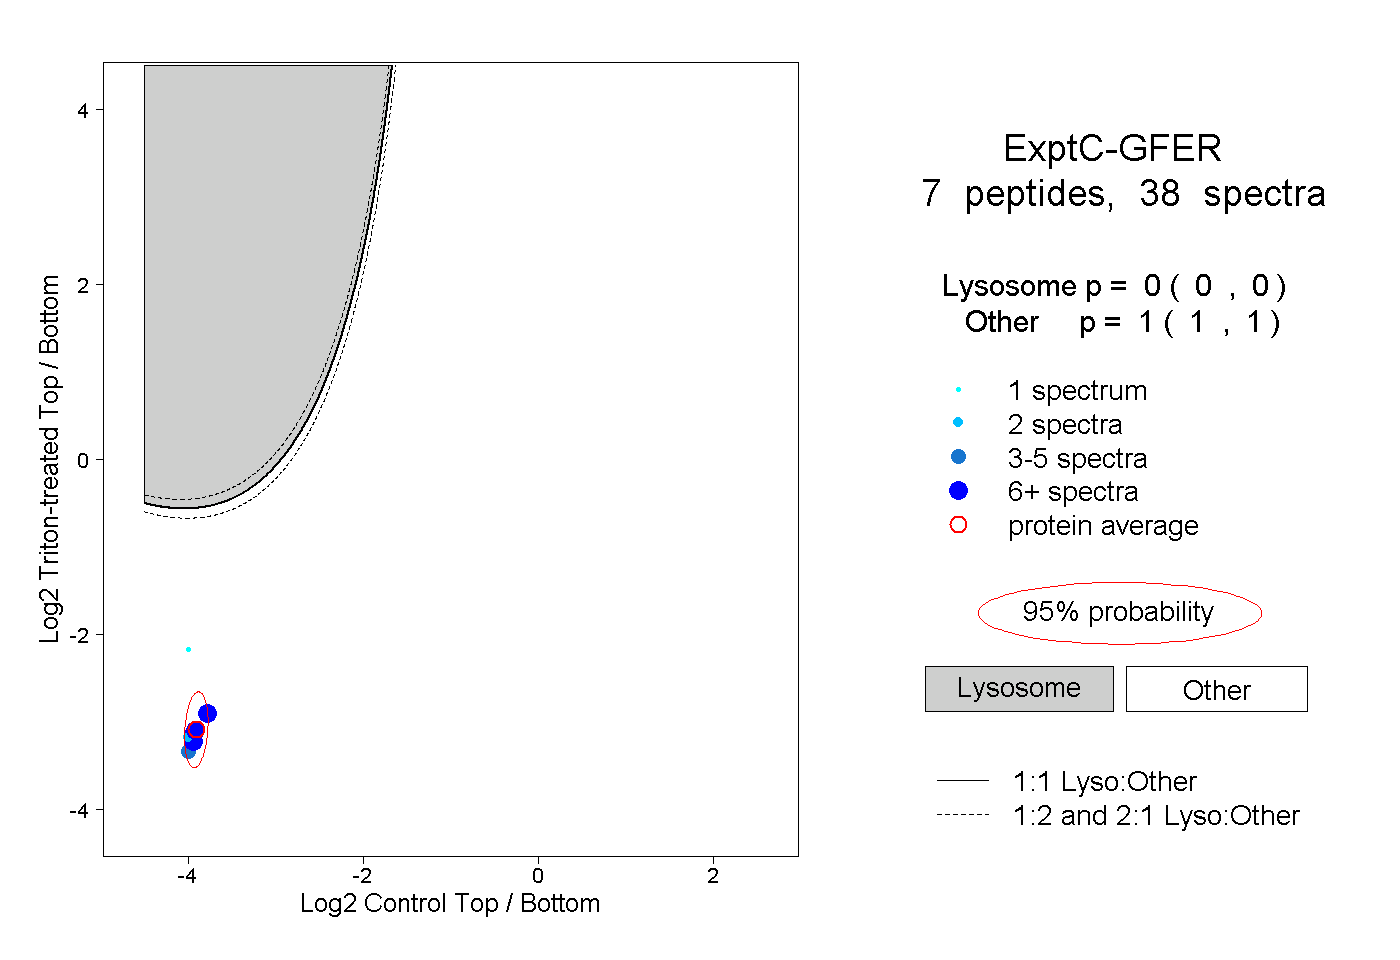
GFER
[ENSRNOP00000017917]
Main page
| | | Plot |
Mito |
Lyso |
|
Perox |
ER |
Golgi |
PM |
Cytosol |
Nucleus |
|
| Expt A |
 3
3
peptides |
9
spectra |
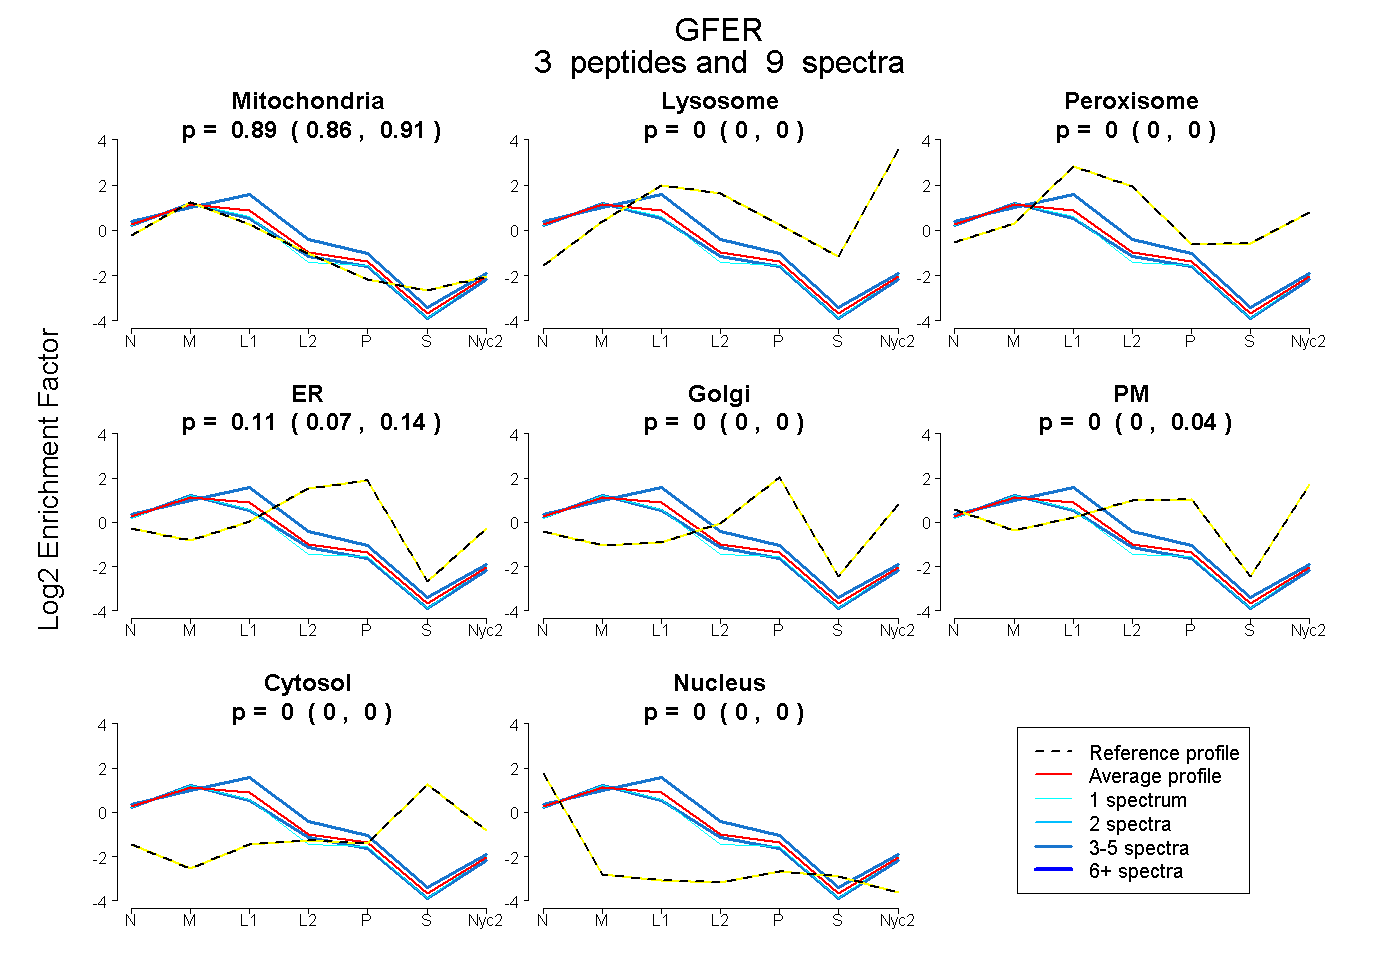 |
0.886
0.857 | 0.906 |
0.000
0.000 | 0.000 |
|
0.000
0.000 | 0.000 |
0.114
0.072 | 0.136 |
0.000
0.000 | 0.000 |
0.000
0.000 | 0.035 |
0.000
0.000 | 0.000 |
0.000
0.000 | 0.002 |
|
| | | Plot |
Mito |
|
Lyso or Perox |
|
ER |
Golgi |
PM |
Cytosol |
Nucleus |
|
| Expt B |
3
peptides |
3
spectra |
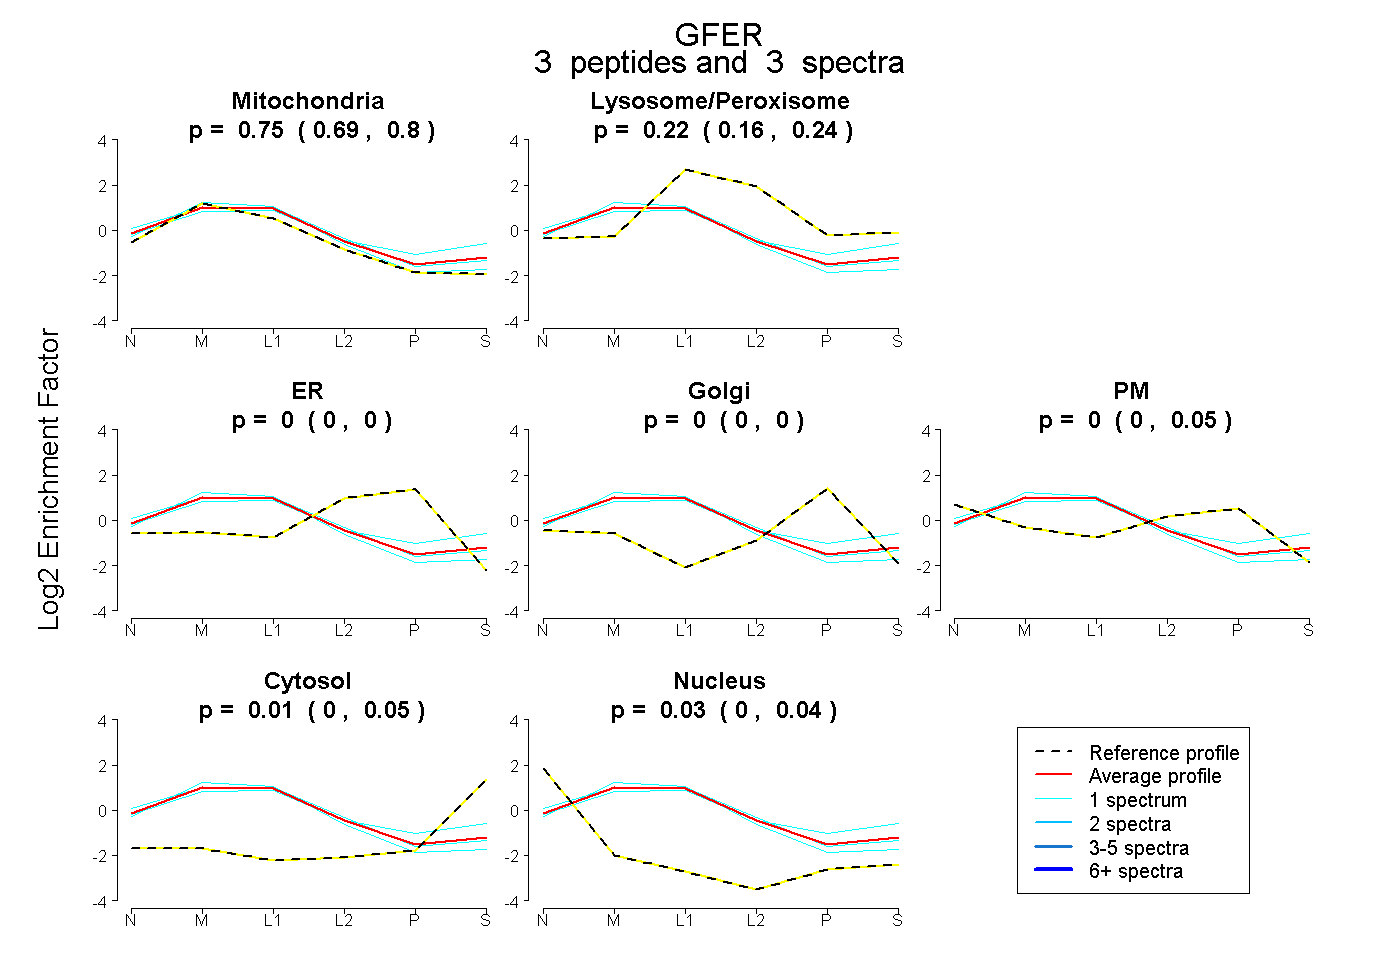 |
0.750
0.685 | 0.804 |
|
0.218
0.163 | 0.245 |
|
0.000
0.000 | 0.000 |
0.000
0.000 | 0.000 |
0.000
0.000 | 0.047 |
0.006
0.000 | 0.052 |
0.026
0.000 | 0.041 |
|
| 1 spectrum, VSFSQWLCR |
0.735 |
|
0.229 |
|
0.000 |
0.000 |
0.000 |
0.000 |
0.036 |
|
| 1 spectrum, LGKPDFDCSR |
0.897 |
|
0.103 |
|
0.000 |
0.000 |
0.000 |
0.000 |
0.000 |
|
| 1 spectrum, ACVDFK |
0.563 |
|
0.284 |
|
0.000 |
0.000 |
0.043 |
0.111 |
0.000 |
|
| | | Plot |
|
Lyso |
|
|
|
|
|
|
|
Other |
| Expt C |
7
peptides |
38
spectra |
 |
|
0.000
0.000 | 0.000 |
|
|
|
|
|
|
|
1.000
1.000 | 1.000 |