 6
6peptides
spectra
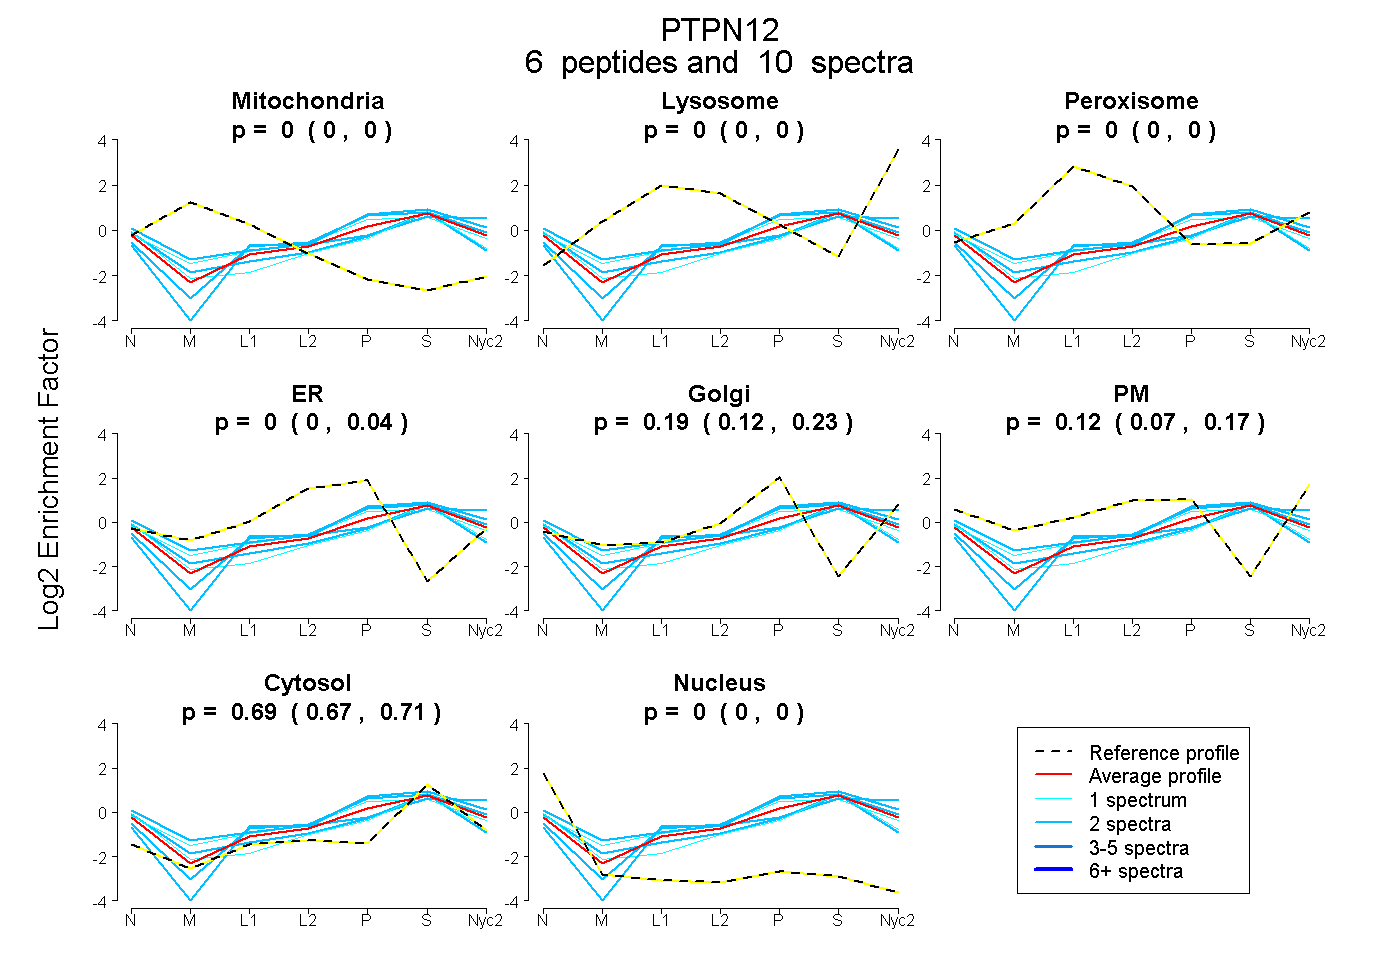
0.000 | 0.000
0.000 | 0.000
0.000 | 0.000
0.000 | 0.035
0.124 | 0.228
0.068 | 0.169
0.670 | 0.706
0.000 | 0.000
| Plot | Mito | Lyso | Perox | ER | Golgi | PM | Cytosol | Nucleus | |||||
| Expt A |
6 peptides |
10 spectra |
|
0.000 0.000 | 0.000 |
0.000 0.000 | 0.000 |
0.000 0.000 | 0.000 |
0.000 0.000 | 0.035 |
0.186 0.124 | 0.228 |
0.125 0.068 | 0.169 |
0.690 0.670 | 0.706 |
0.000 0.000 | 0.000 |
| 2 spectra, TDYFIR | 0.000 | 0.007 | 0.000 | 0.000 | 0.000 | 0.386 | 0.607 | 0.000 | ||
| 2 spectra, VLPMSIAR | 0.000 | 0.000 | 0.000 | 0.000 | 0.296 | 0.000 | 0.704 | 0.000 | ||
| 2 spectra, TPESFVLADMPIR | 0.000 | 0.000 | 0.000 | 0.081 | 0.259 | 0.000 | 0.660 | 0.000 | ||
| 1 spectrum, TLLLEFQNESR | 0.000 | 0.000 | 0.000 | 0.000 | 0.150 | 0.048 | 0.716 | 0.087 | ||
| 2 spectra, ISCENEQAR | 0.000 | 0.000 | 0.000 | 0.076 | 0.060 | 0.091 | 0.708 | 0.065 | ||
| 1 spectrum, QLQLYEIHGAQK | 0.000 | 0.000 | 0.021 | 0.075 | 0.206 | 0.107 | 0.591 | 0.000 |
| Plot | Mito | Lyso or Perox | ER | Golgi | PM | Cytosol | Nucleus | ||||||
| Expt B |
1 peptide |
1 spectrum |
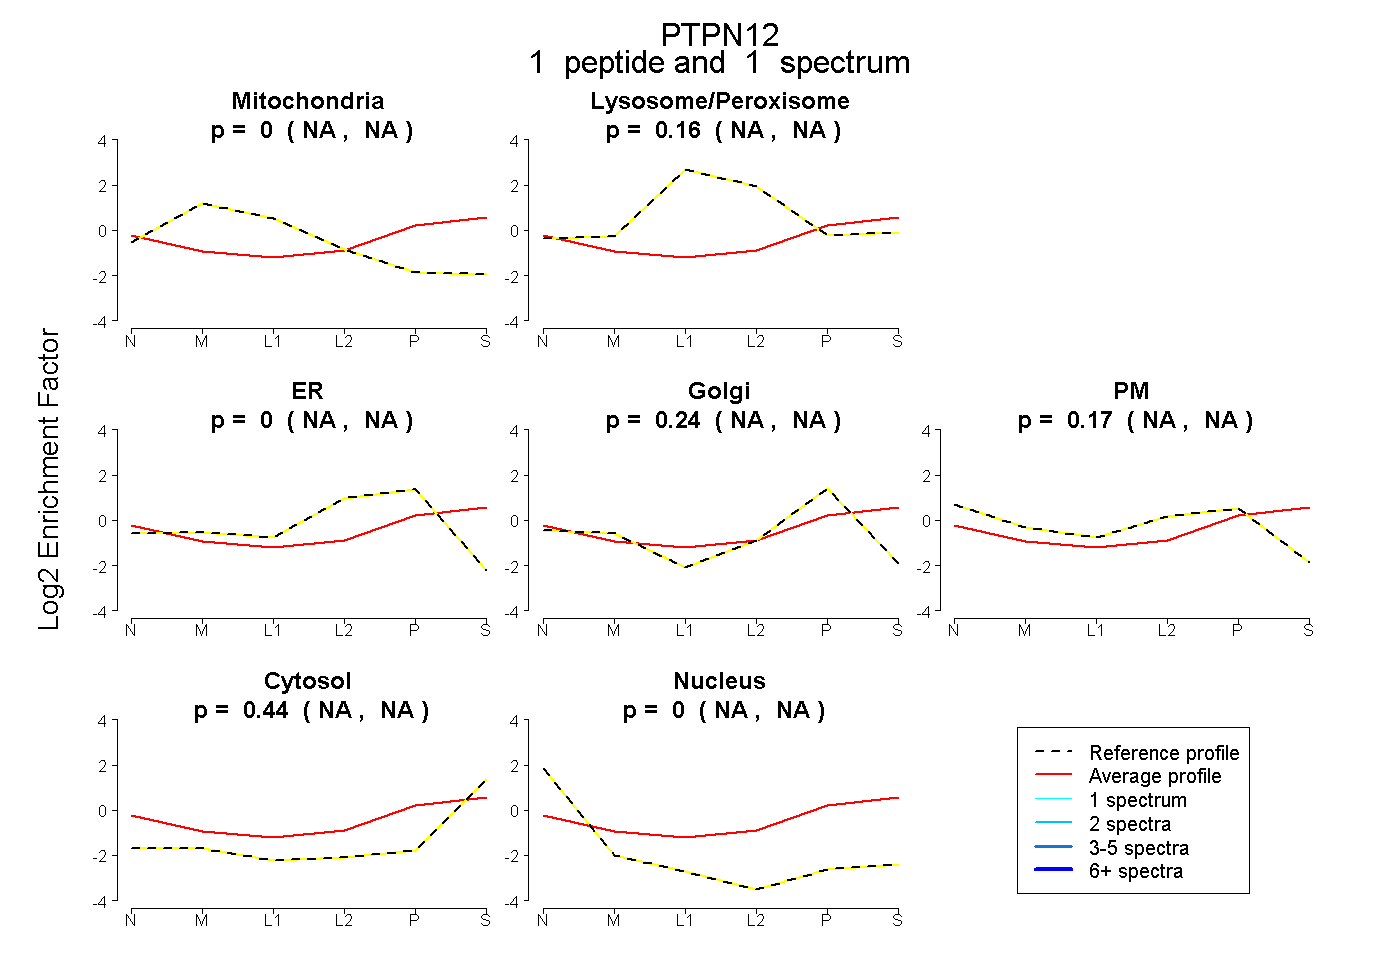 |
0.000 NA | NA |
0.156 NA | NA |
0.000 NA | NA |
0.235 NA | NA |
0.171 NA | NA |
0.437 NA | NA |
0.000 NA | NA |
|||
| Plot | Lyso | Other | |||||||||||
| Expt C |
2 peptides |
5 spectra |
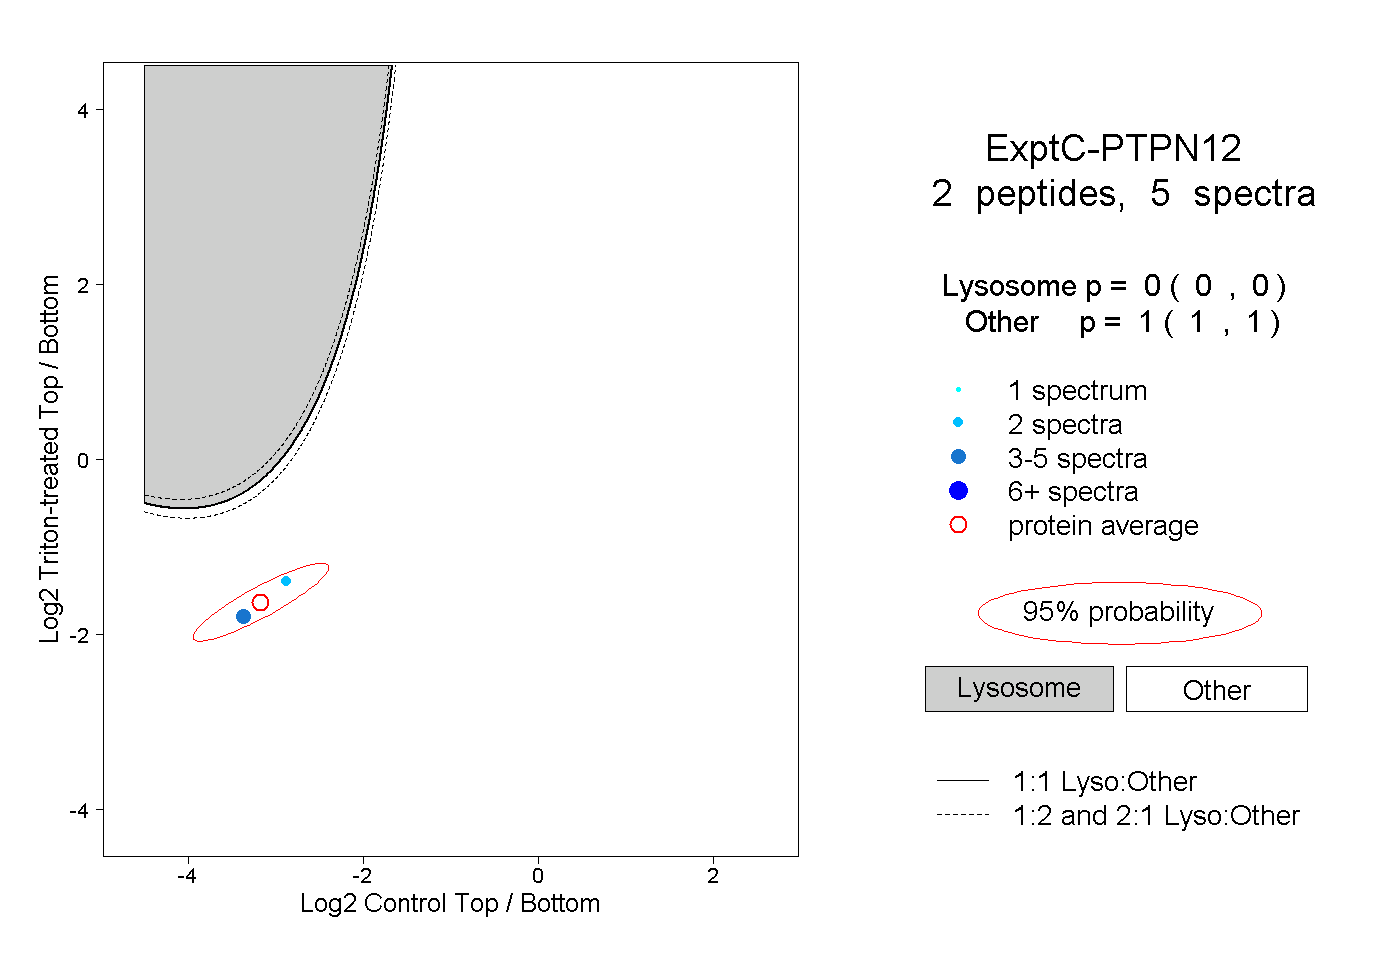 |
0.000 0.000 | 0.000 |
1.000 1.000 | 1.000 |