 2
2peptides
spectra
0.000 | 0.000
0.000 | 0.000
0.000 | 0.037
0.290 | 0.448
0.162 | 0.308
0.000 | 0.000
0.284 | 0.331
0.043 | 0.076
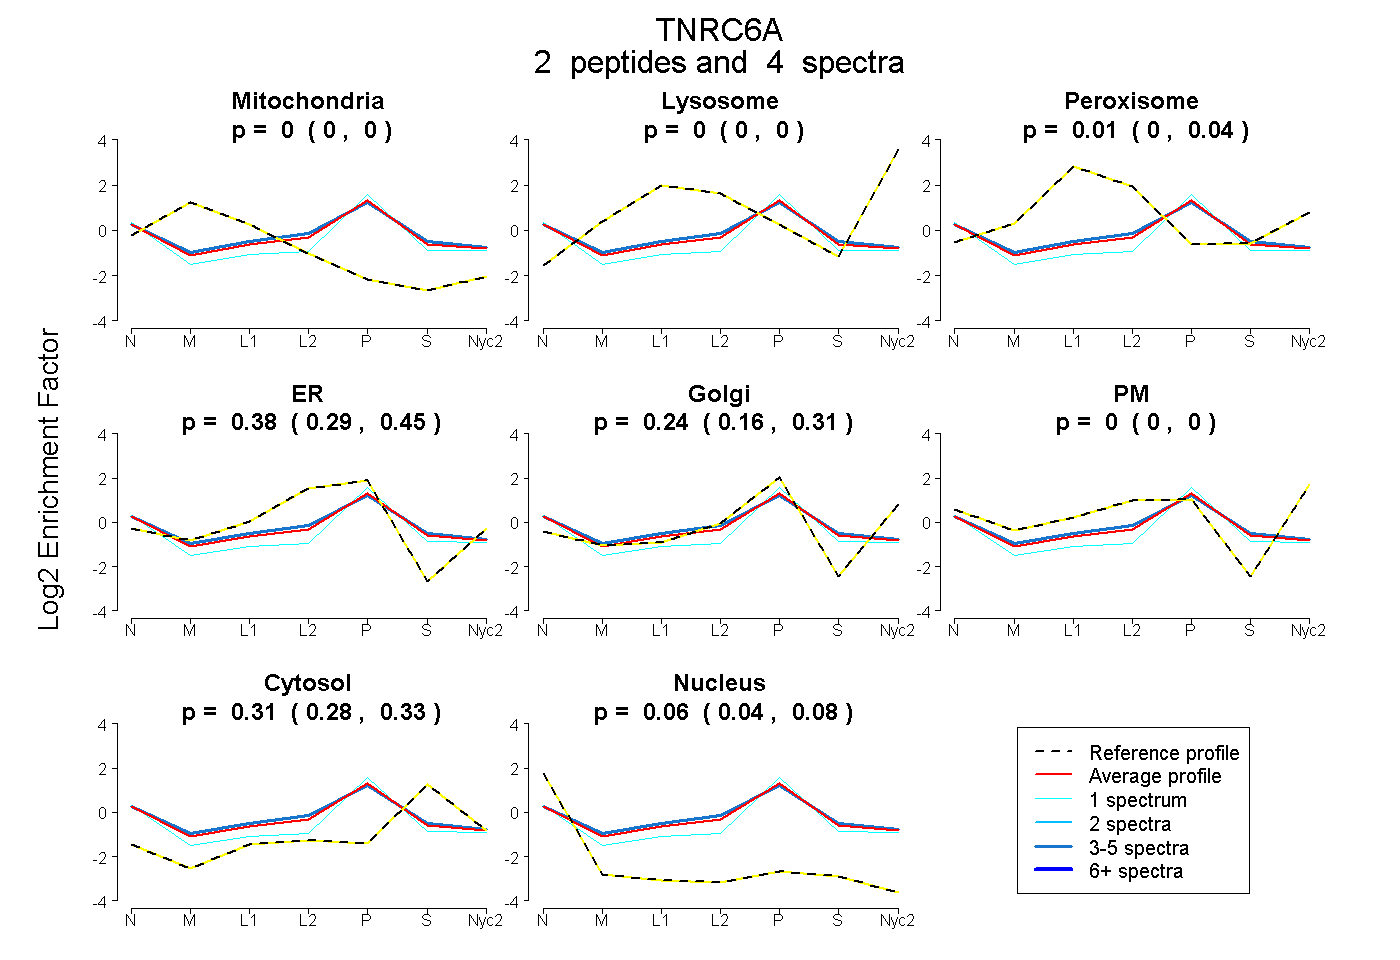
| Plot | Mito | Lyso | Perox | ER | Golgi | PM | Cytosol | Nucleus | |||||
| Expt A |
2 peptides |
4 spectra |
|
0.000 0.000 | 0.000 |
0.000 0.000 | 0.000 |
0.007 0.000 | 0.037 |
0.382 0.290 | 0.448 |
0.239 0.162 | 0.308 |
0.000 0.000 | 0.000 |
0.313 0.284 | 0.331 |
0.059 0.043 | 0.076 |
| 1 spectrum, LLAQQQR | 0.000 | 0.000 | 0.000 | 0.110 | 0.521 | 0.000 | 0.238 | 0.131 | ||
| 3 spectra, EVDHLR | 0.000 | 0.000 | 0.050 | 0.410 | 0.179 | 0.000 | 0.314 | 0.047 |