 2
2peptides
spectra
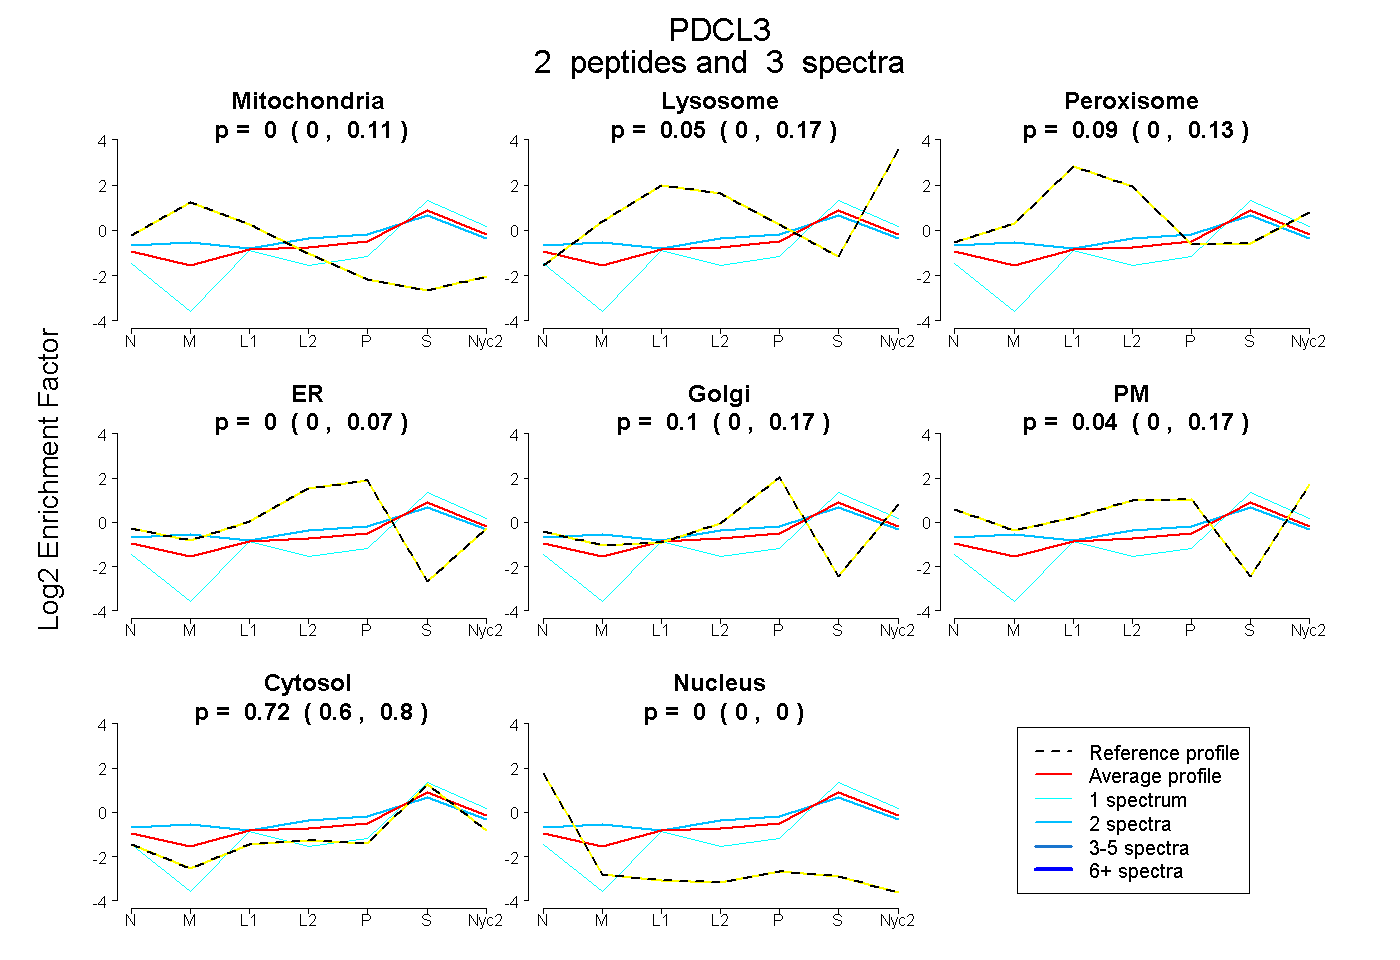
0.000 | 0.113
0.000 | 0.167
0.000 | 0.132
0.000 | 0.068
0.000 | 0.173
0.000 | 0.171
0.605 | 0.801
0.000 | 0.000
1peptide
spectrum
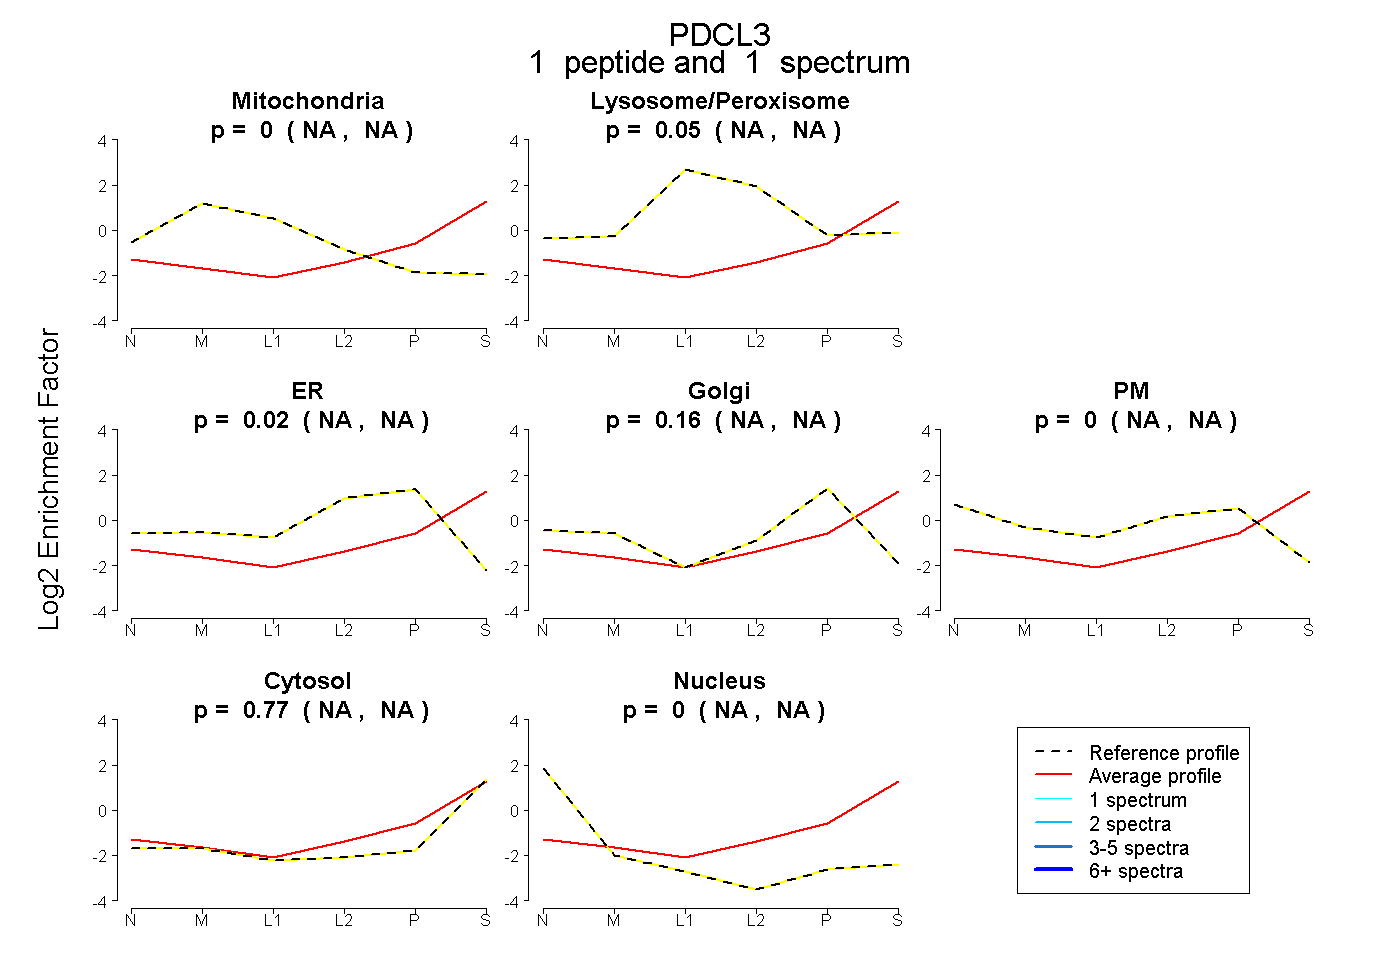
NA | NA
NA | NA
NA | NA
NA | NA
NA | NA
NA | NA
NA | NA
1peptide
spectra
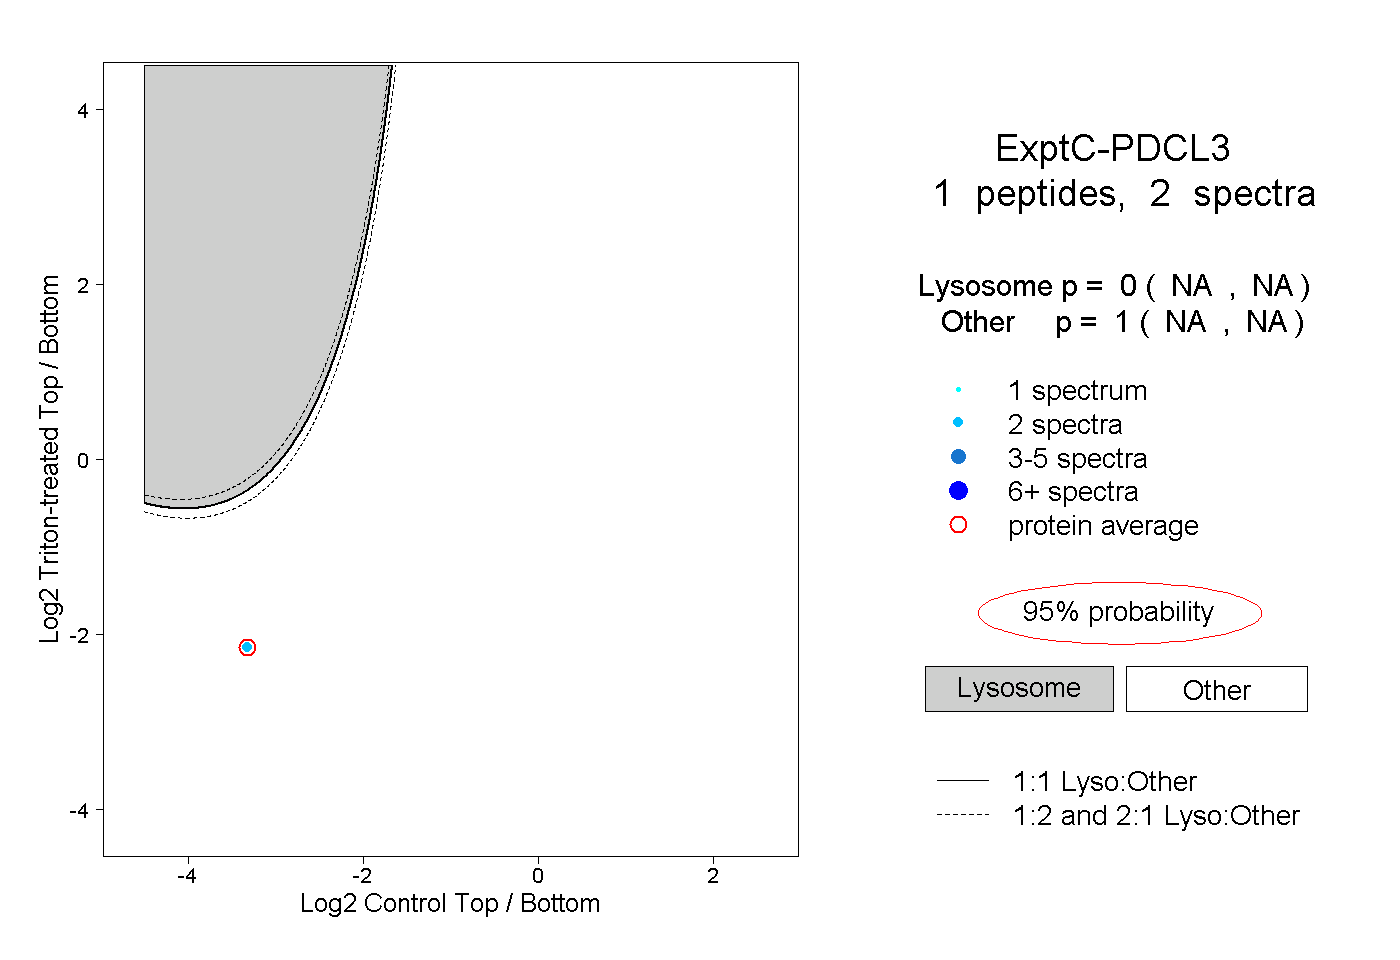
NA | NA
NA | NA
1peptide
spectrum
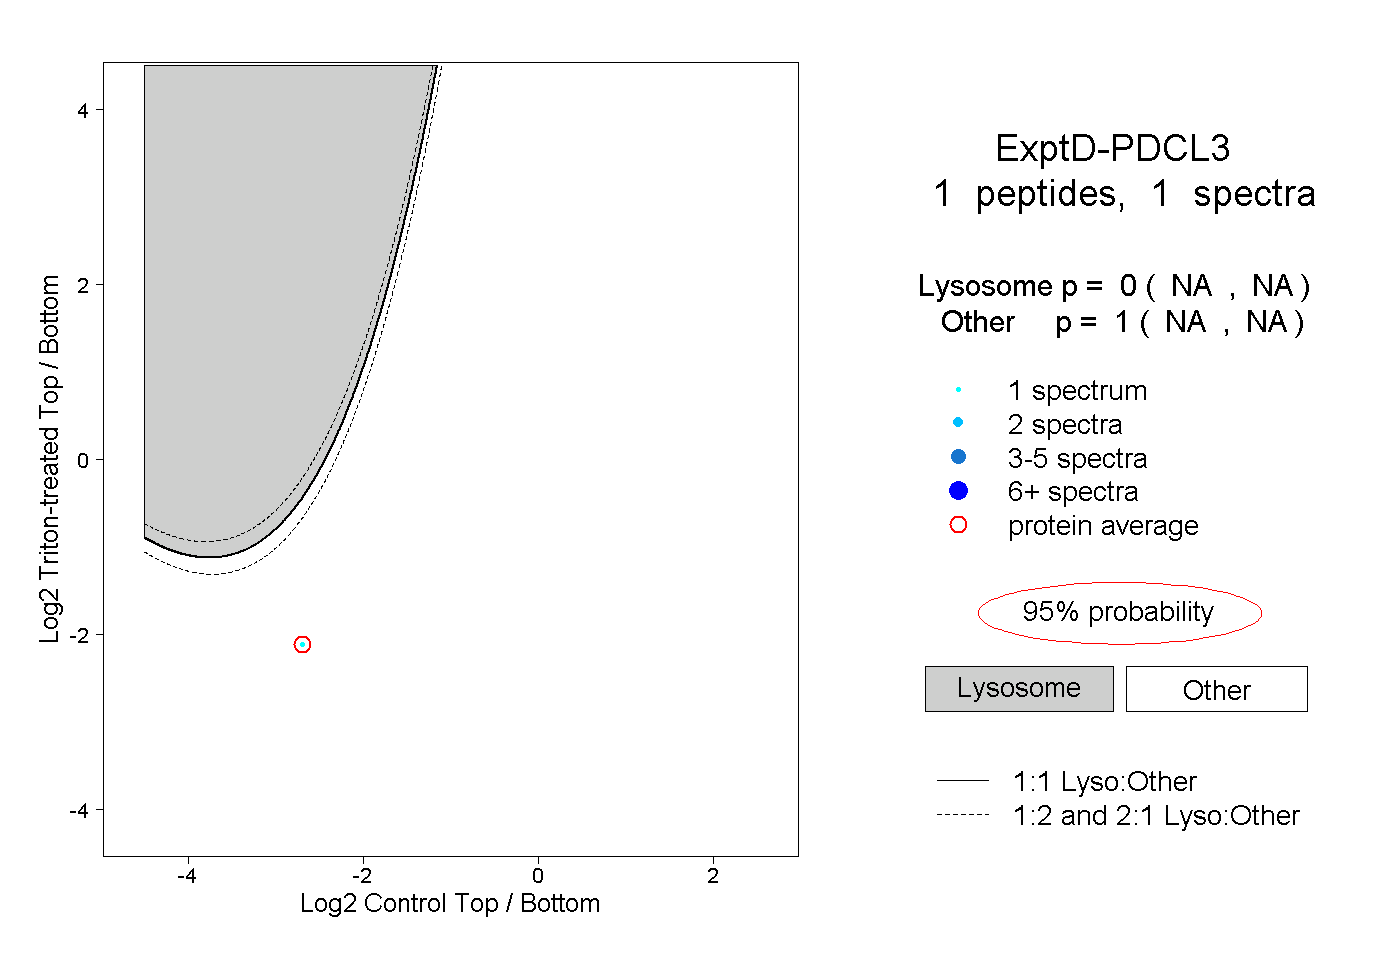
NA | NA
NA | NA