 6
6peptides
spectra
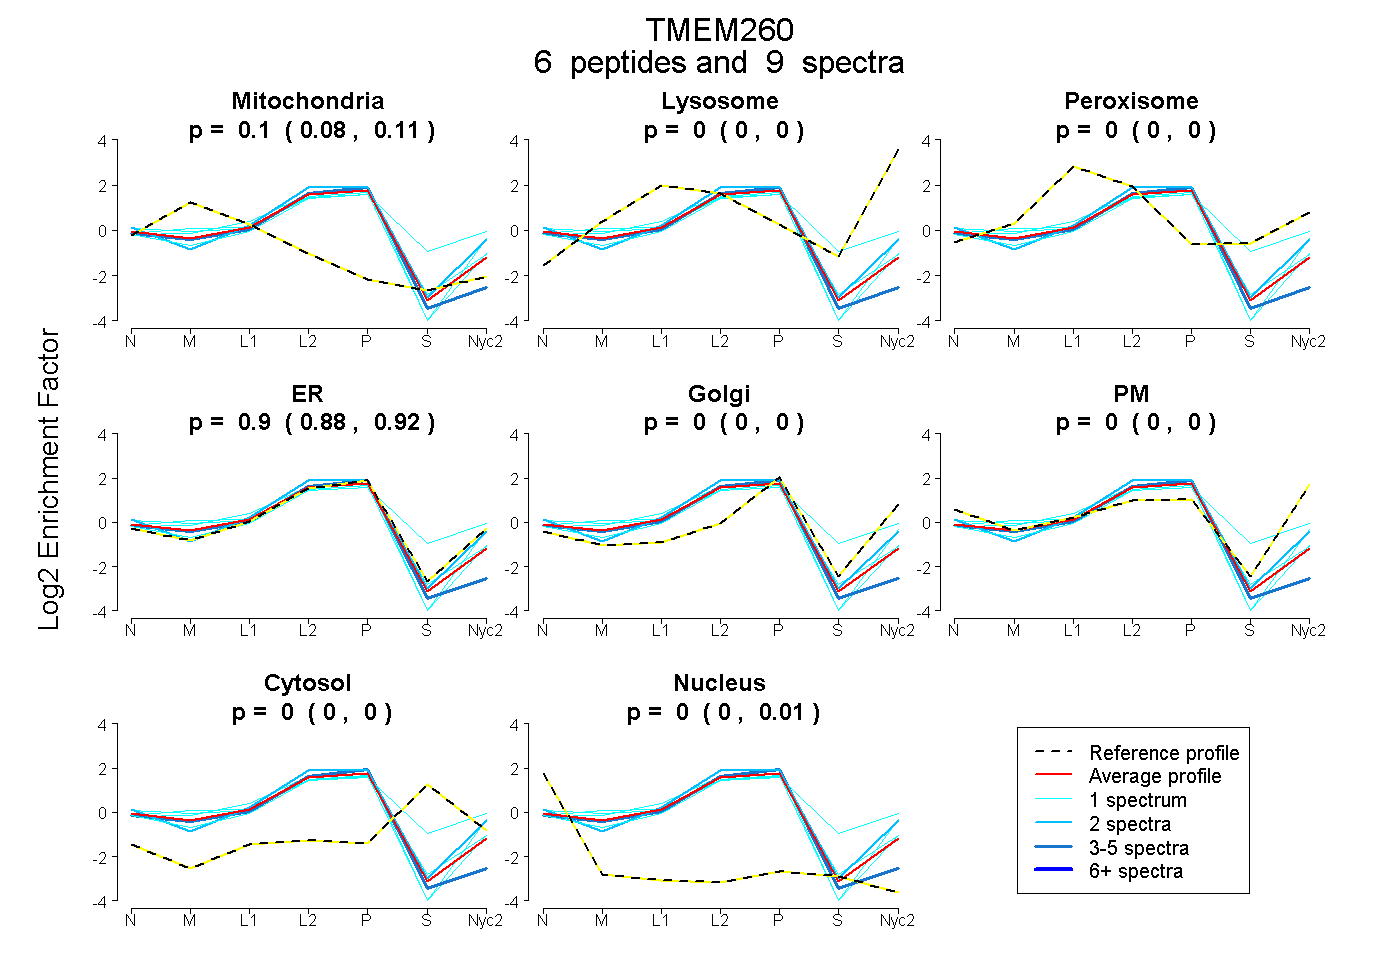
0.077 | 0.115
0.000 | 0.000
0.000 | 0.000
0.878 | 0.920
0.000 | 0.000
0.000 | 0.000
0.000 | 0.000
0.000 | 0.011
1peptide
spectrum
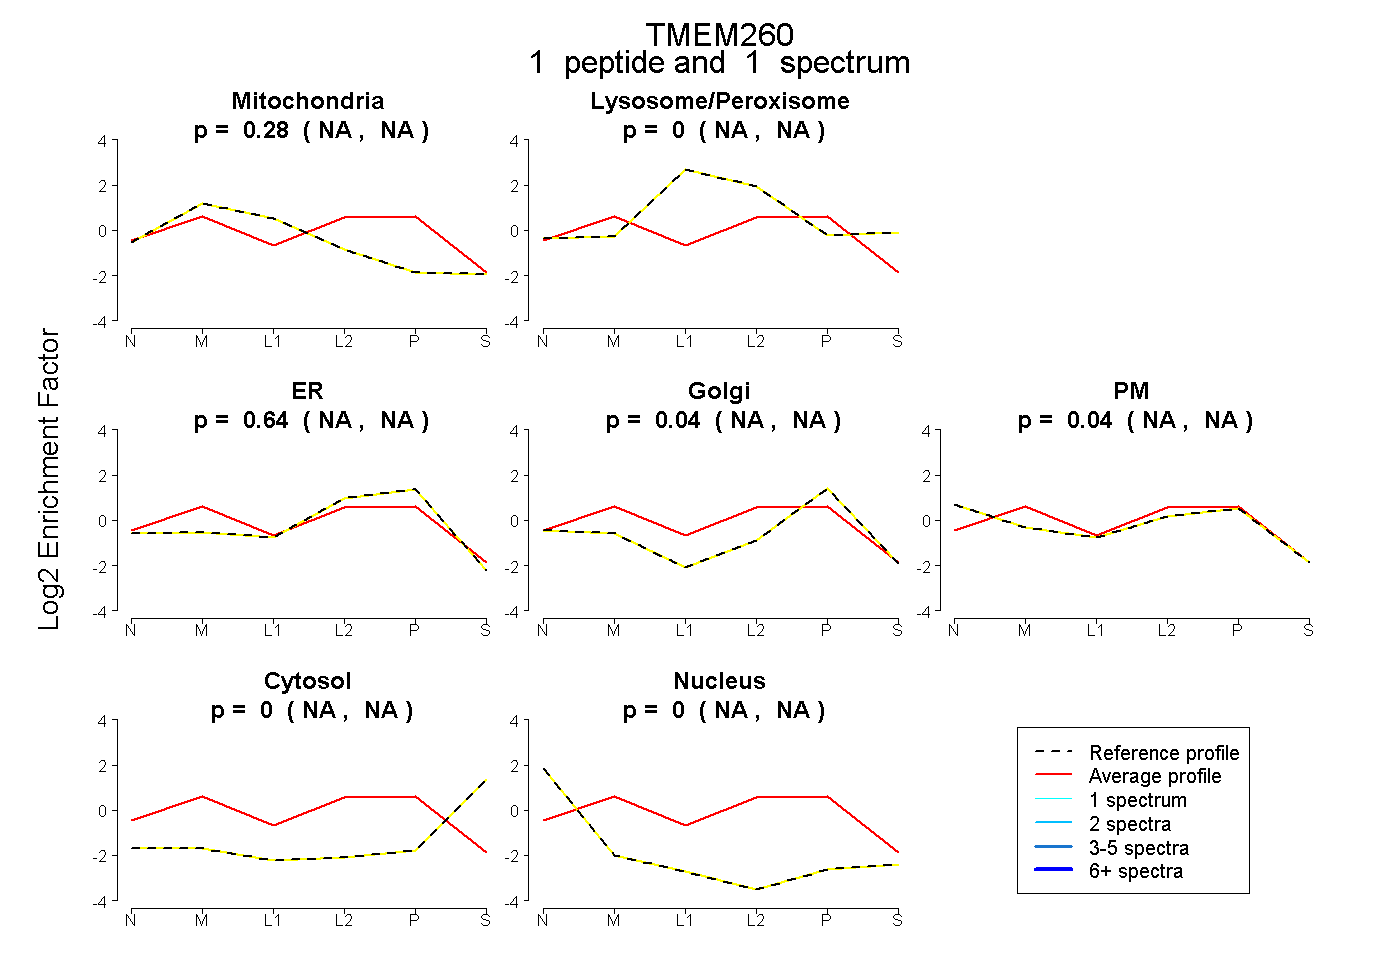
NA | NA
NA | NA
NA | NA
NA | NA
NA | NA
NA | NA
NA | NA
4peptides
spectra
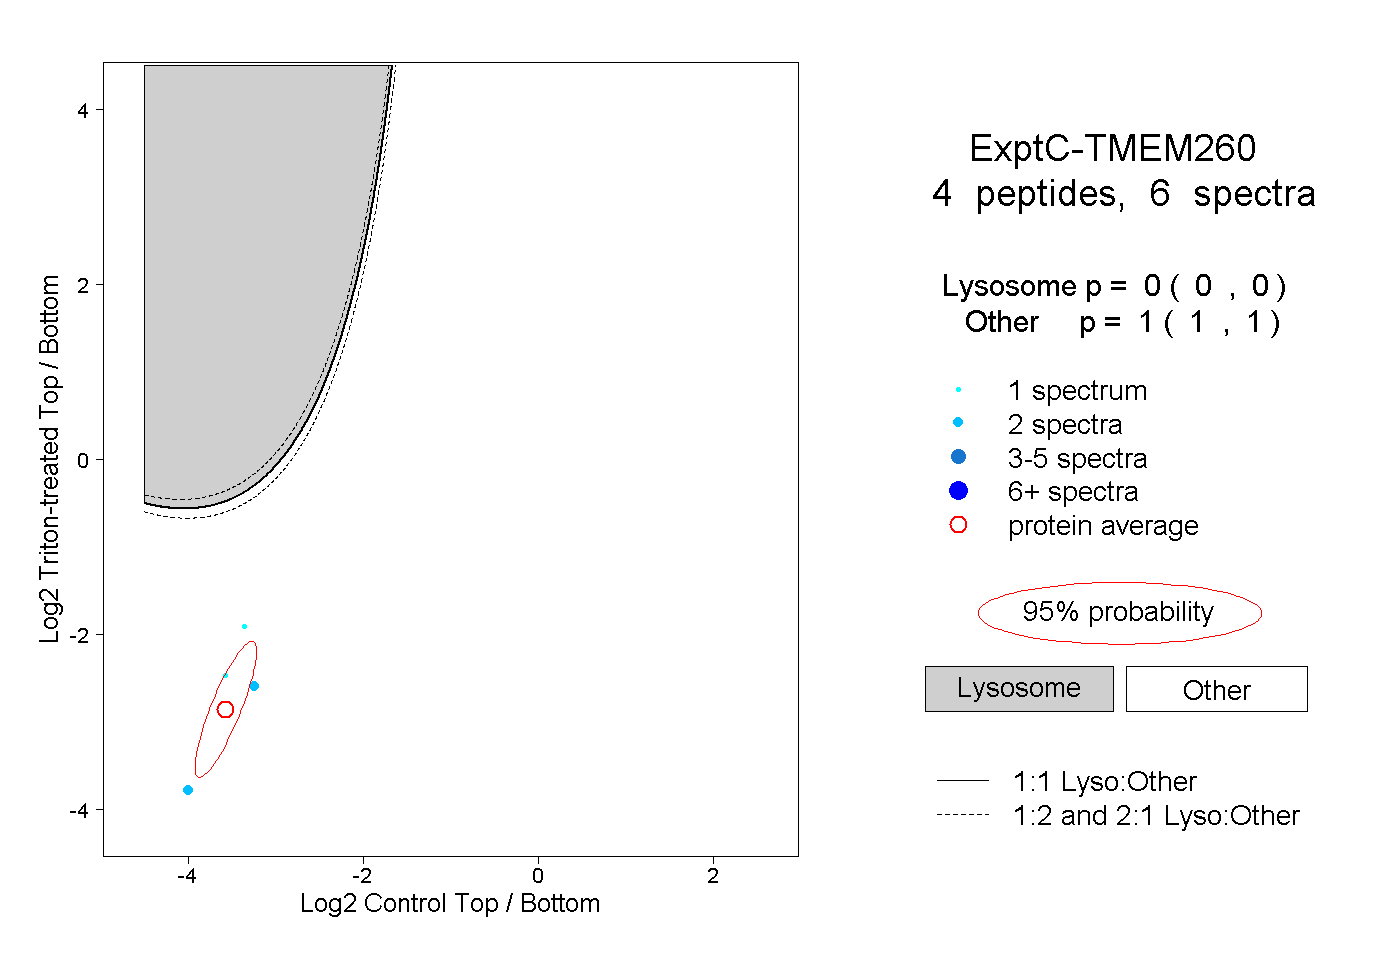
0.000 | 0.000
1.000 | 1.000