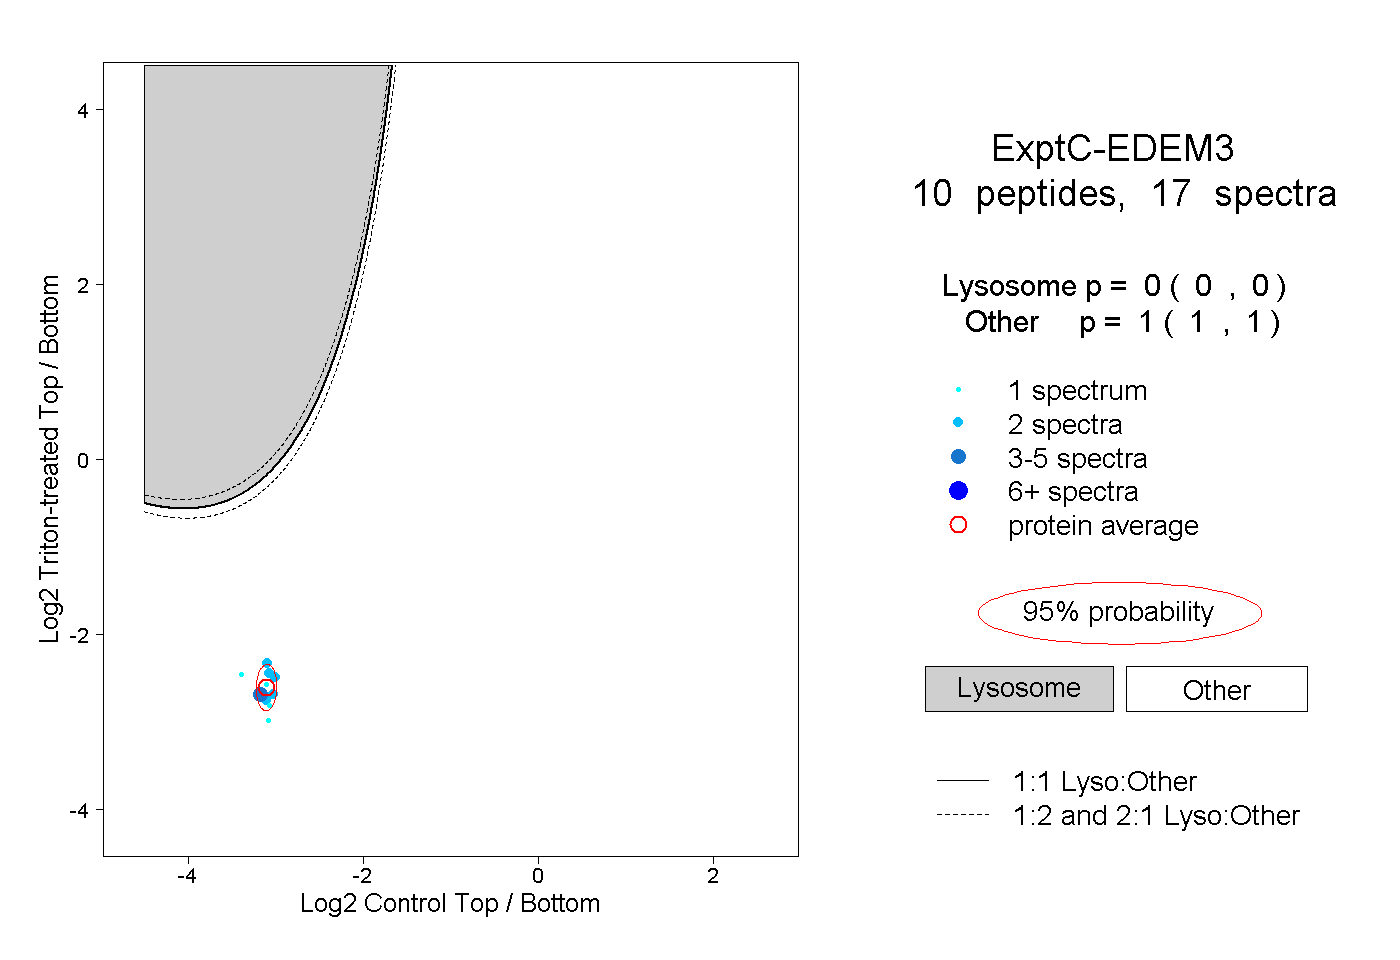
10
10peptides
spectra
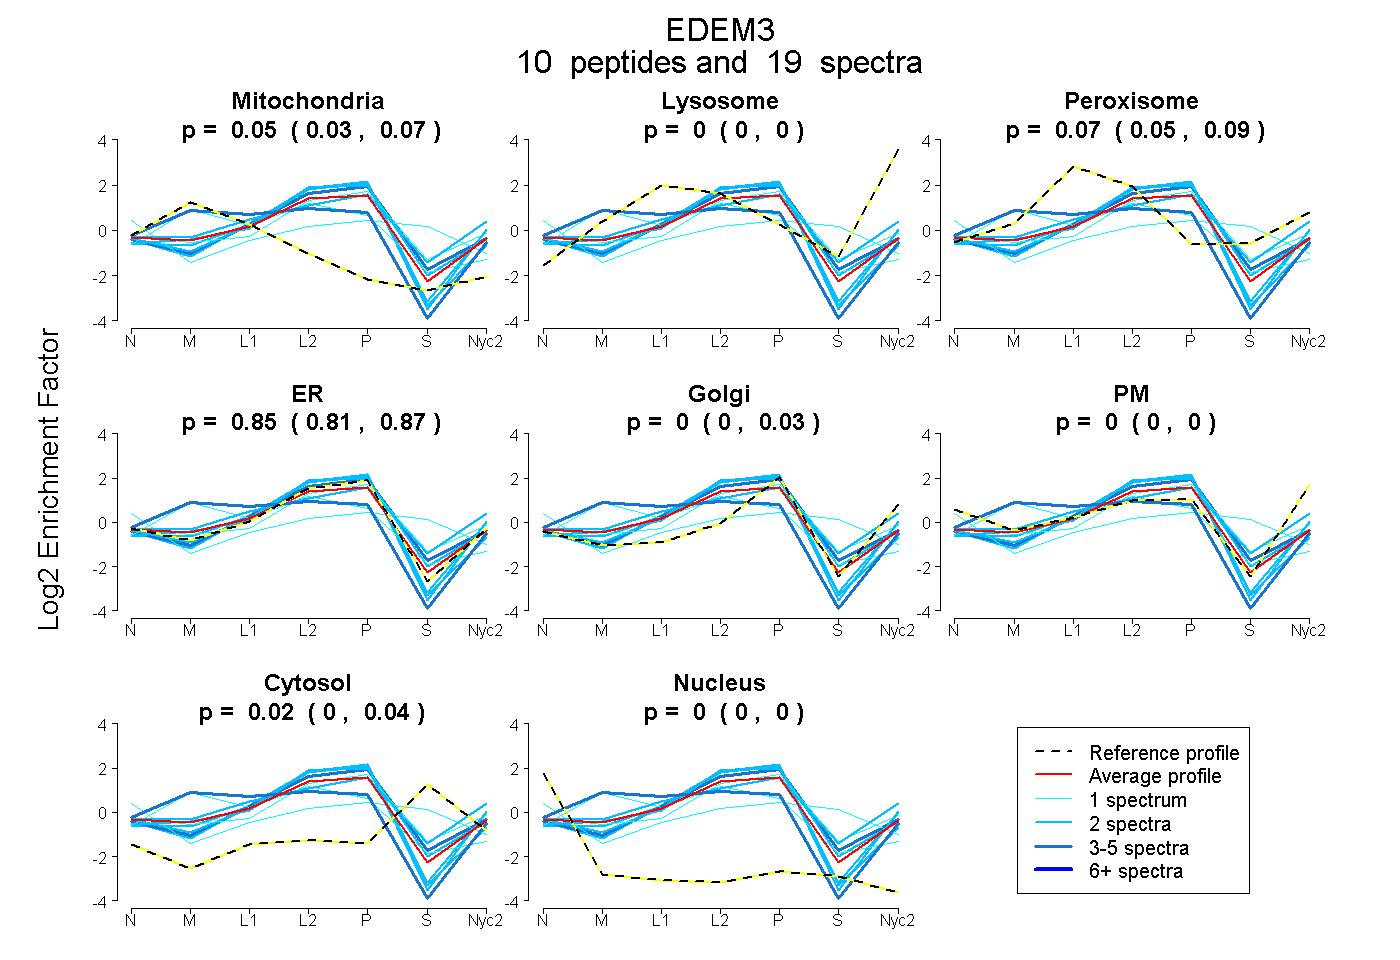
0.028 | 0.074
0.000 | 0.000
0.048 | 0.093
0.812 | 0.875
0.000 | 0.030
0.000 | 0.000
0.000 | 0.038
0.000 | 0.000
5peptides
spectra
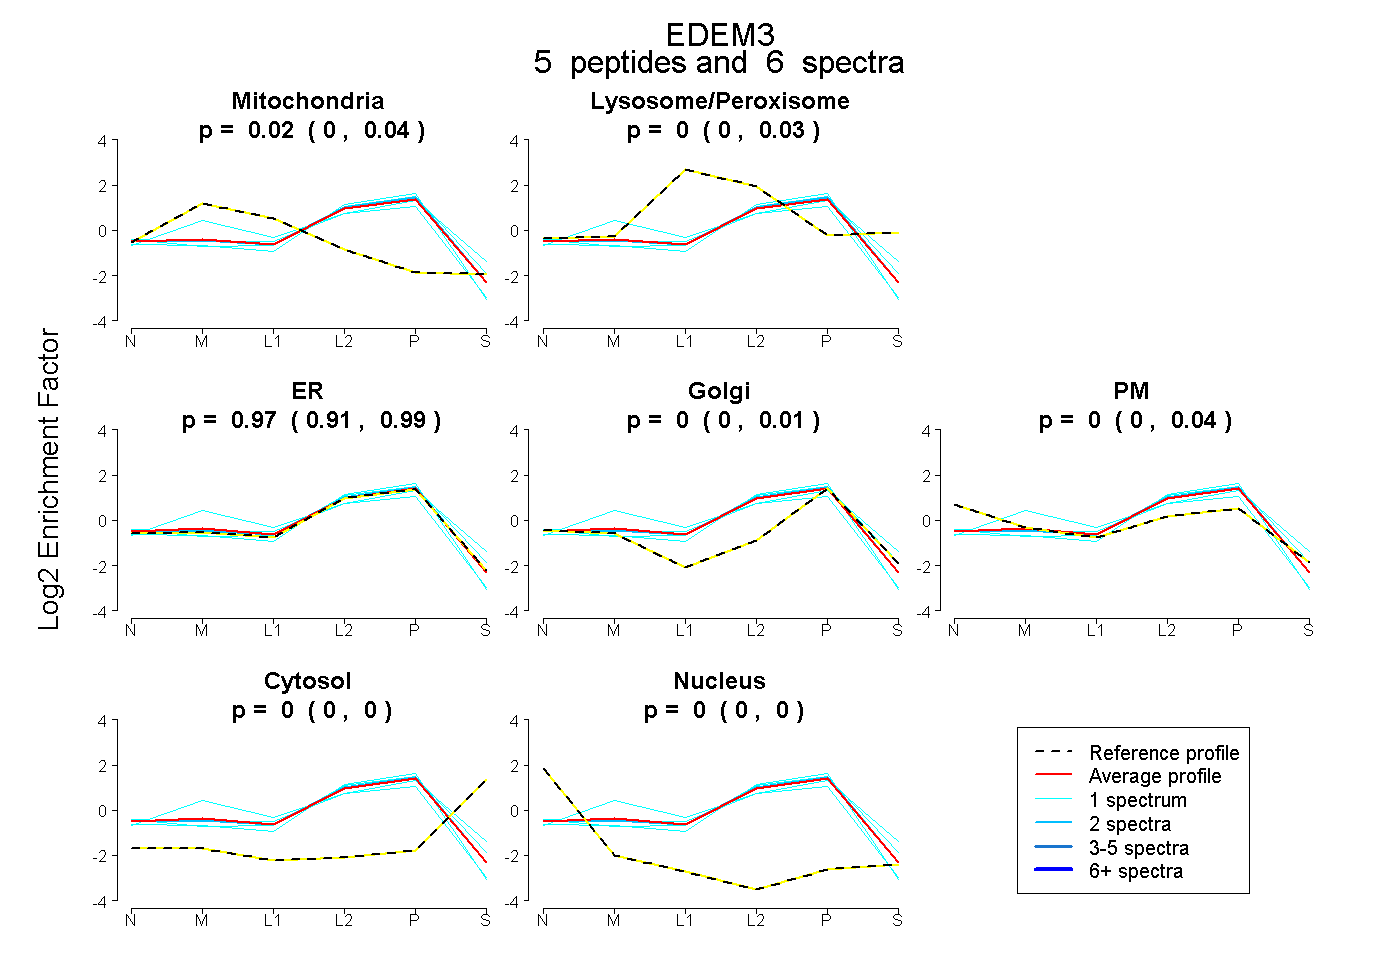
0.000 | 0.038
0.000 | 0.033
0.909 | 0.990
0.000 | 0.010
0.000 | 0.039
0.000 | 0.000
0.000 | 0.000