 10
10peptides
spectra
0.028 | 0.074
0.000 | 0.000
0.048 | 0.093
0.812 | 0.875
0.000 | 0.030
0.000 | 0.000
0.000 | 0.038
0.000 | 0.000
| Plot | Mito | Lyso | Perox | ER | Golgi | PM | Cytosol | Nucleus | |||||
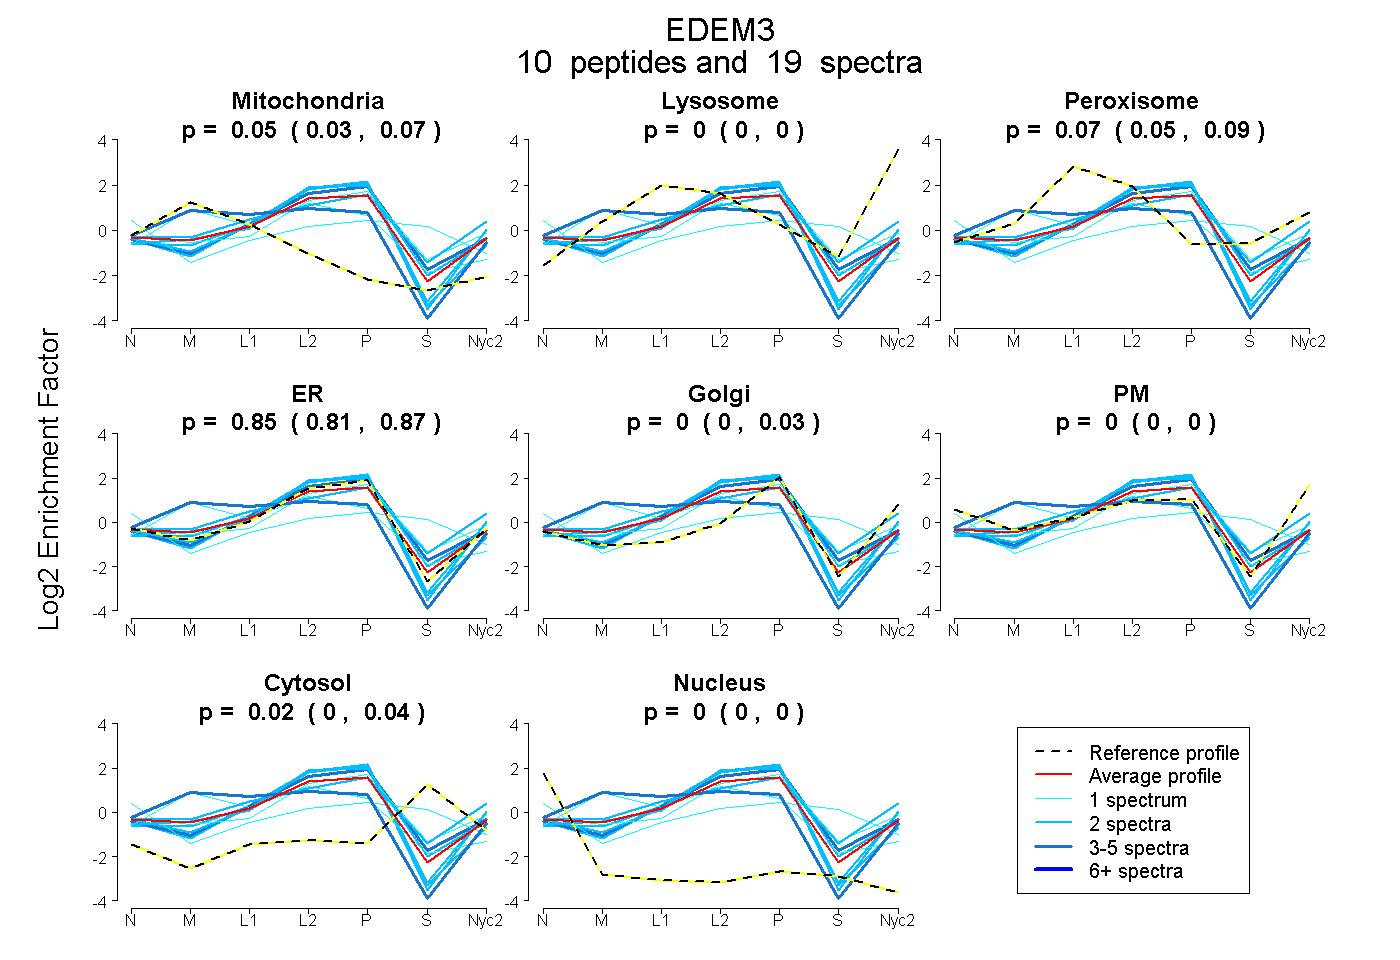
| Expt A |
10 peptides |
19 spectra |
|
0.053 0.028 | 0.074 |
0.000 0.000 | 0.000 |
0.074 0.048 | 0.093 |
0.854 0.812 | 0.875 |
0.000 0.000 | 0.030 |
0.000 0.000 | 0.000 |
0.019 0.000 | 0.038 |
0.000 0.000 | 0.000 |
| 2 spectra, ALDFLWEK | 0.000 | 0.000 | 0.000 | 1.000 | 0.000 | 0.000 | 0.000 | 0.000 | ||
| 2 spectra, FTGATVFEEYAR | 0.000 | 0.019 | 0.000 | 0.981 | 0.000 | 0.000 | 0.000 | 0.000 | ||
| 3 spectra, VEESFR | 0.322 | 0.032 | 0.000 | 0.585 | 0.000 | 0.061 | 0.000 | 0.000 | ||
| 1 spectrum, EHEQVEVLLSDK | 0.000 | 0.000 | 0.114 | 0.387 | 0.000 | 0.000 | 0.434 | 0.064 | ||
| 1 spectrum, FMQEMIELSSQQQK | 0.000 | 0.008 | 0.075 | 0.699 | 0.081 | 0.008 | 0.128 | 0.000 | ||
| 3 spectra, AYVLLGDDSFLER | 0.000 | 0.000 | 0.072 | 0.857 | 0.000 | 0.000 | 0.070 | 0.000 | ||
| 2 spectra, EGSIILDAIR | 0.000 | 0.000 | 0.056 | 0.917 | 0.000 | 0.000 | 0.027 | 0.000 | ||
| 1 spectrum, MDSFFLAEMFK | 0.333 | 0.000 | 0.119 | 0.548 | 0.000 | 0.000 | 0.000 | 0.000 | ||
| 2 spectra, MGVSLIHLK | 0.000 | 0.000 | 0.309 | 0.303 | 0.385 | 0.000 | 0.003 | 0.000 | ||
| 2 spectra, AVQIISHPFFGR | 0.000 | 0.003 | 0.000 | 0.997 | 0.000 | 0.000 | 0.000 | 0.000 |
| Plot | Mito | Lyso or Perox | ER | Golgi | PM | Cytosol | Nucleus | ||||||
| Expt B |
5 peptides |
6 spectra |
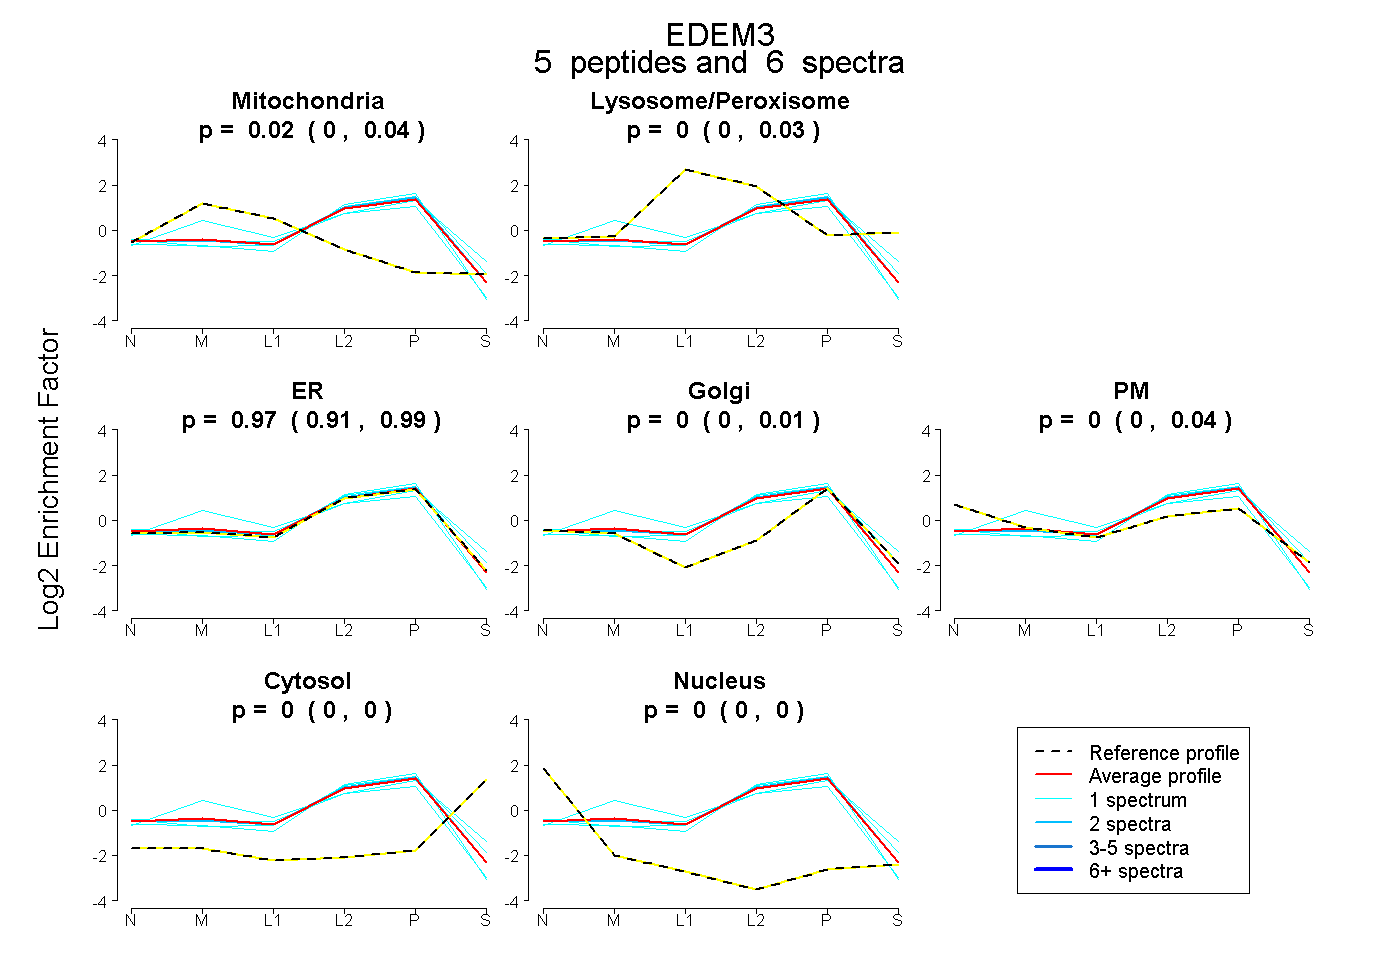 |
0.022 0.000 | 0.038 |
0.004 0.000 | 0.033 |
0.975 0.909 | 0.990 |
0.000 0.000 | 0.010 |
0.000 0.000 | 0.039 |
0.000 0.000 | 0.000 |
0.000 0.000 | 0.000 |
|||
| Plot | Lyso | Other | |||||||||||
| Expt C |
10 peptides |
17 spectra |
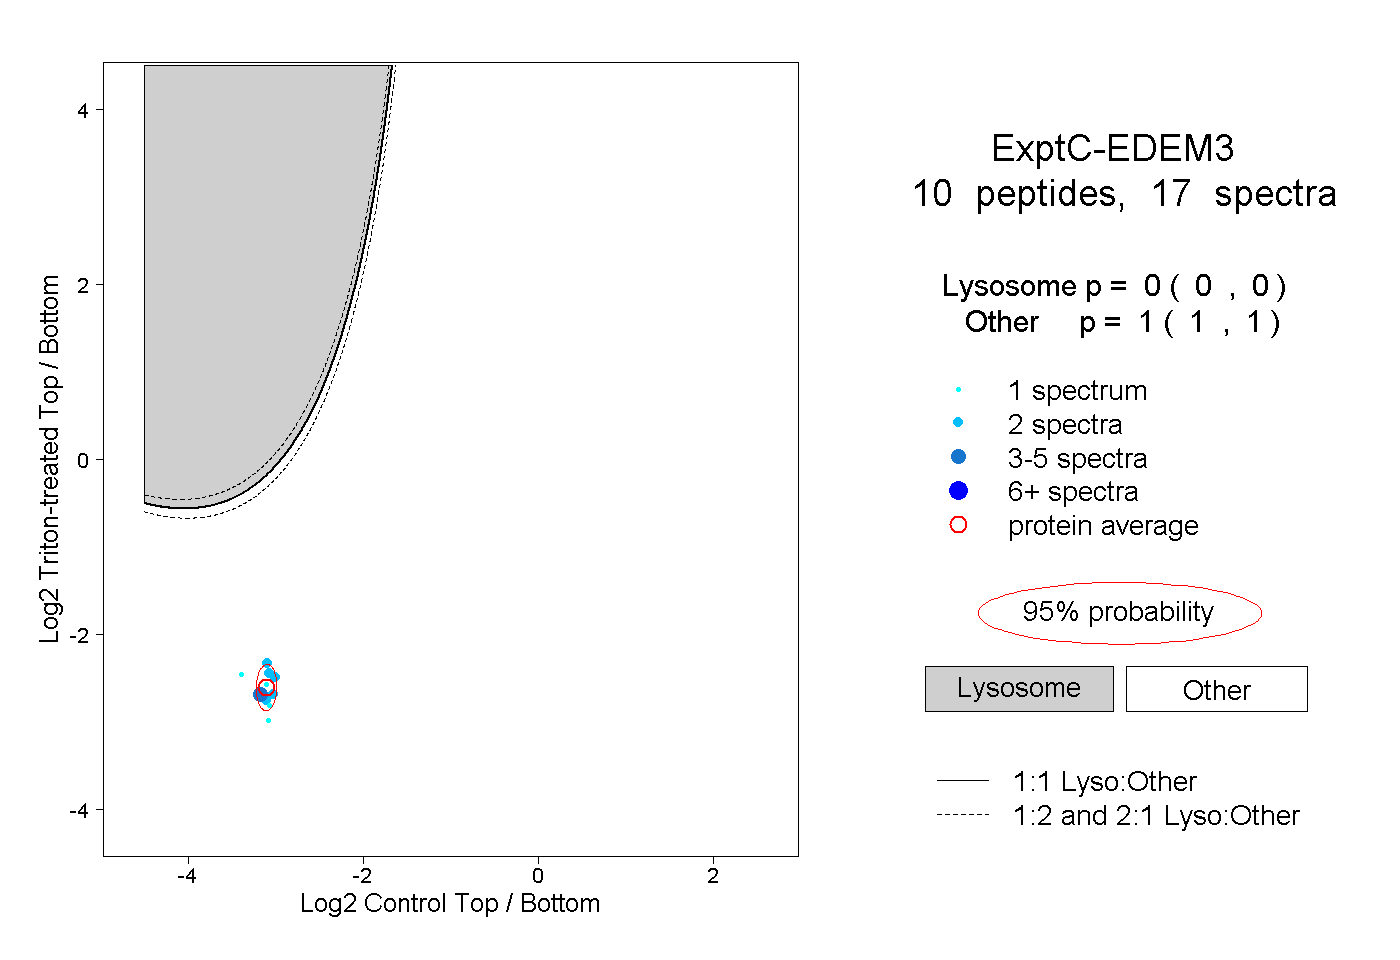 |
0.000 0.000 | 0.000 |
1.000 1.000 | 1.000 |
||||||||
| Plot | Lyso | Other | |||||||||||
| Expt D |
1 peptide |
1 spectrum |
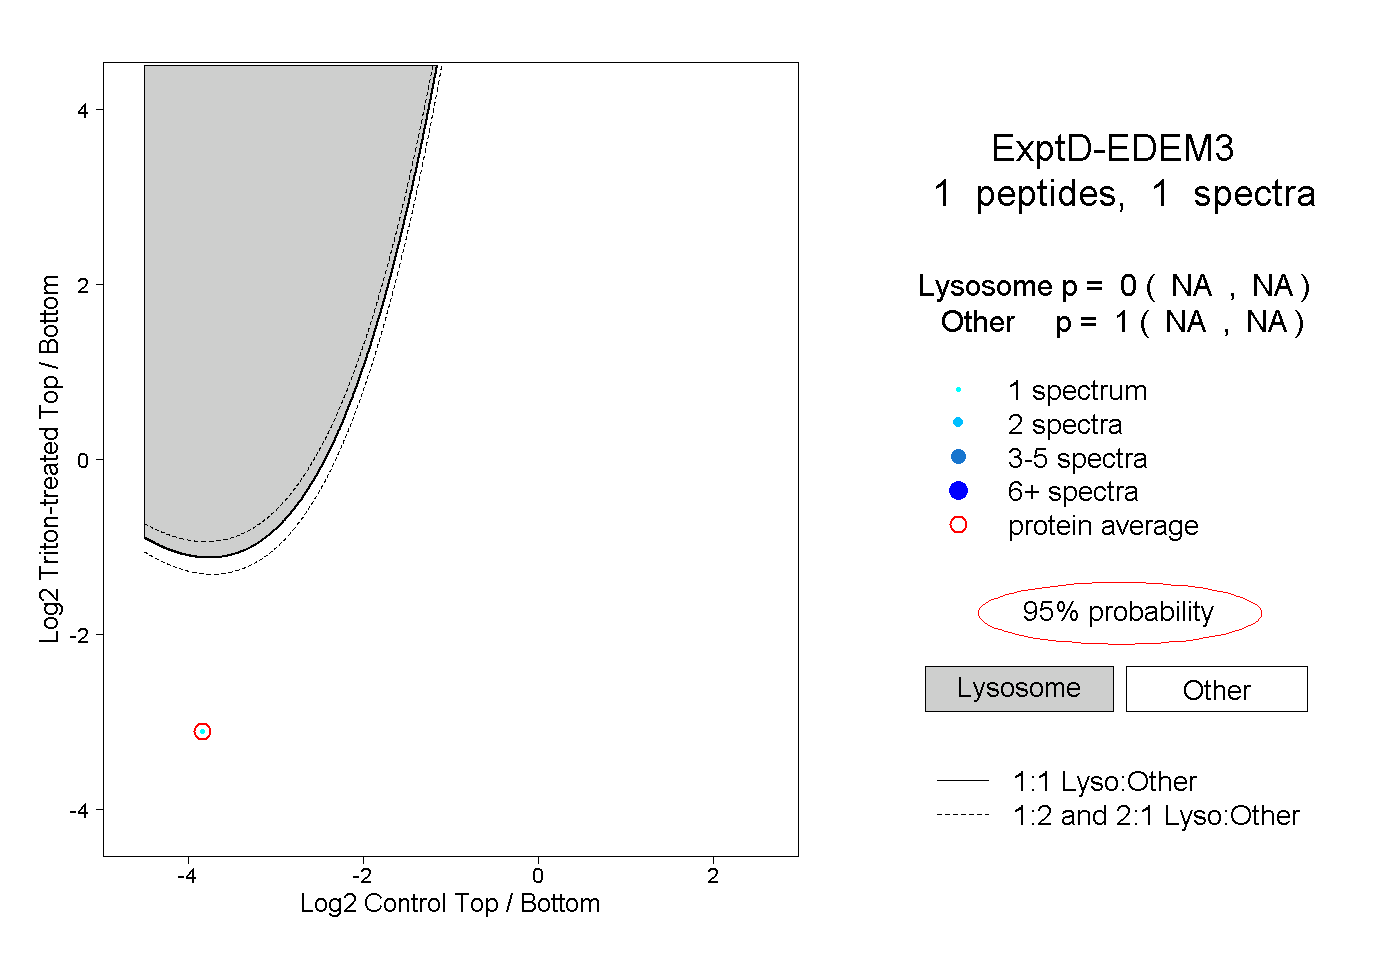 |
0.000 NA | NA |
1.000 NA | NA |