 7
7peptides
spectra
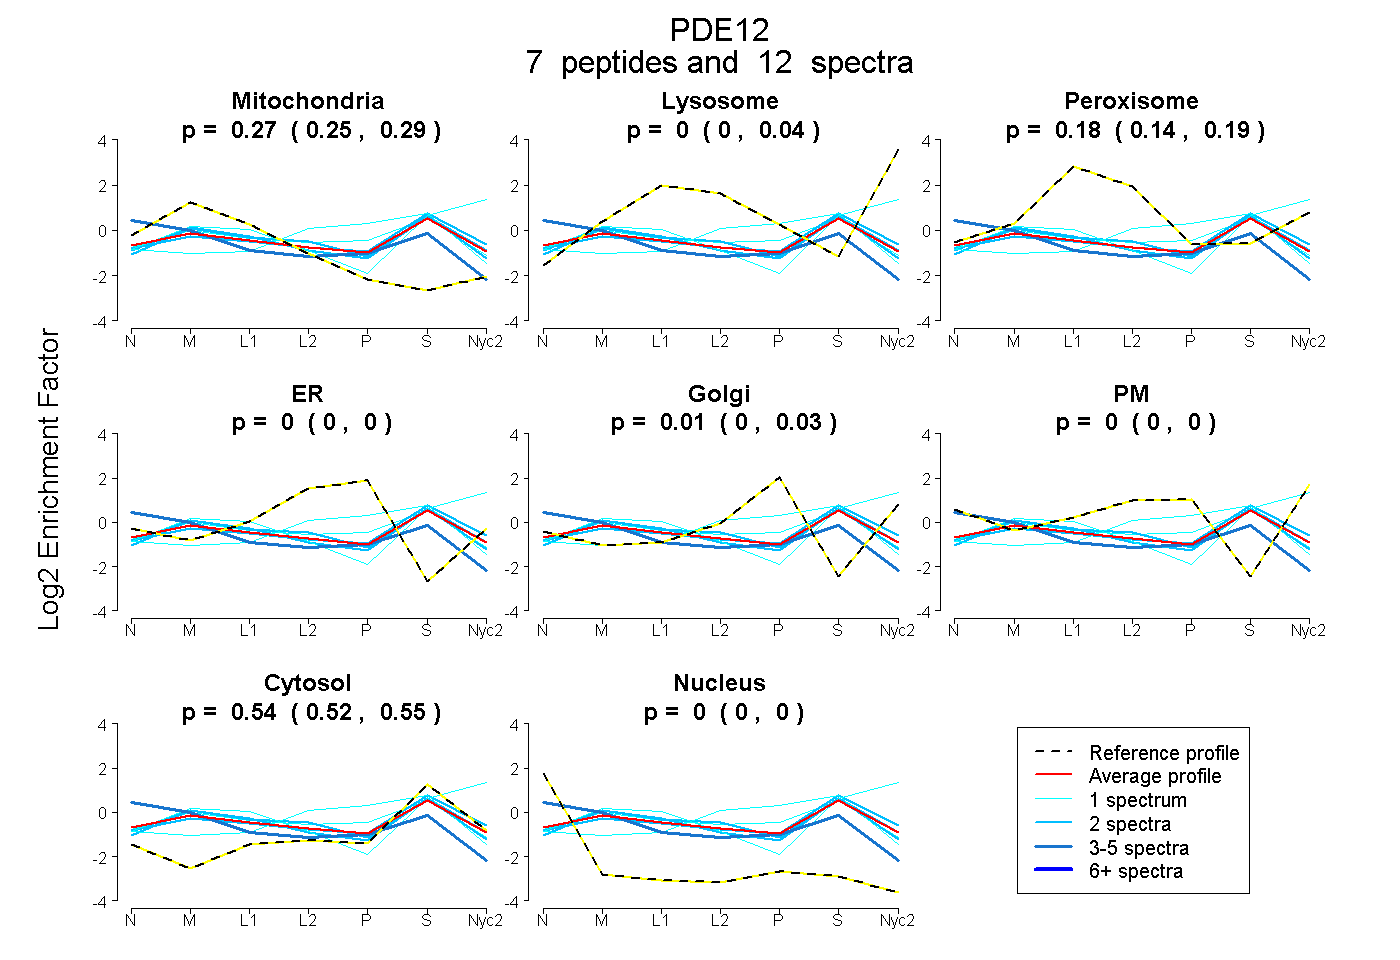
0.247 | 0.294
0.000 | 0.036
0.145 | 0.194
0.000 | 0.000
0.000 | 0.029
0.000 | 0.001
0.520 | 0.549
0.000 | 0.000
2peptides
spectra
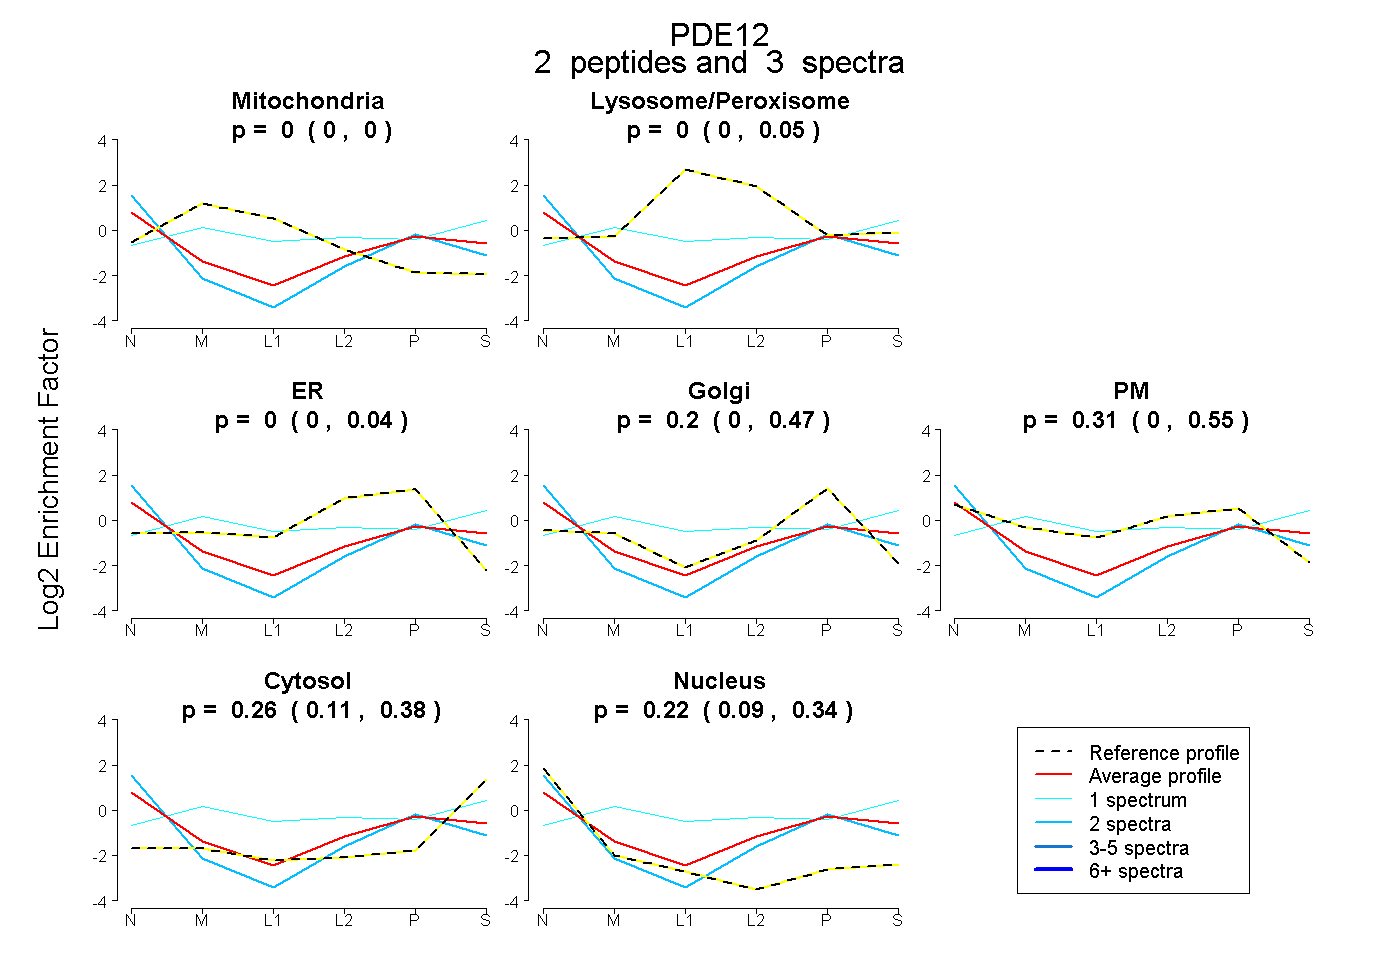
0.000 | 0.000
0.000 | 0.046
0.000 | 0.044
0.000 | 0.470
0.000 | 0.553
0.112 | 0.380
0.090 | 0.341
14peptides
spectra
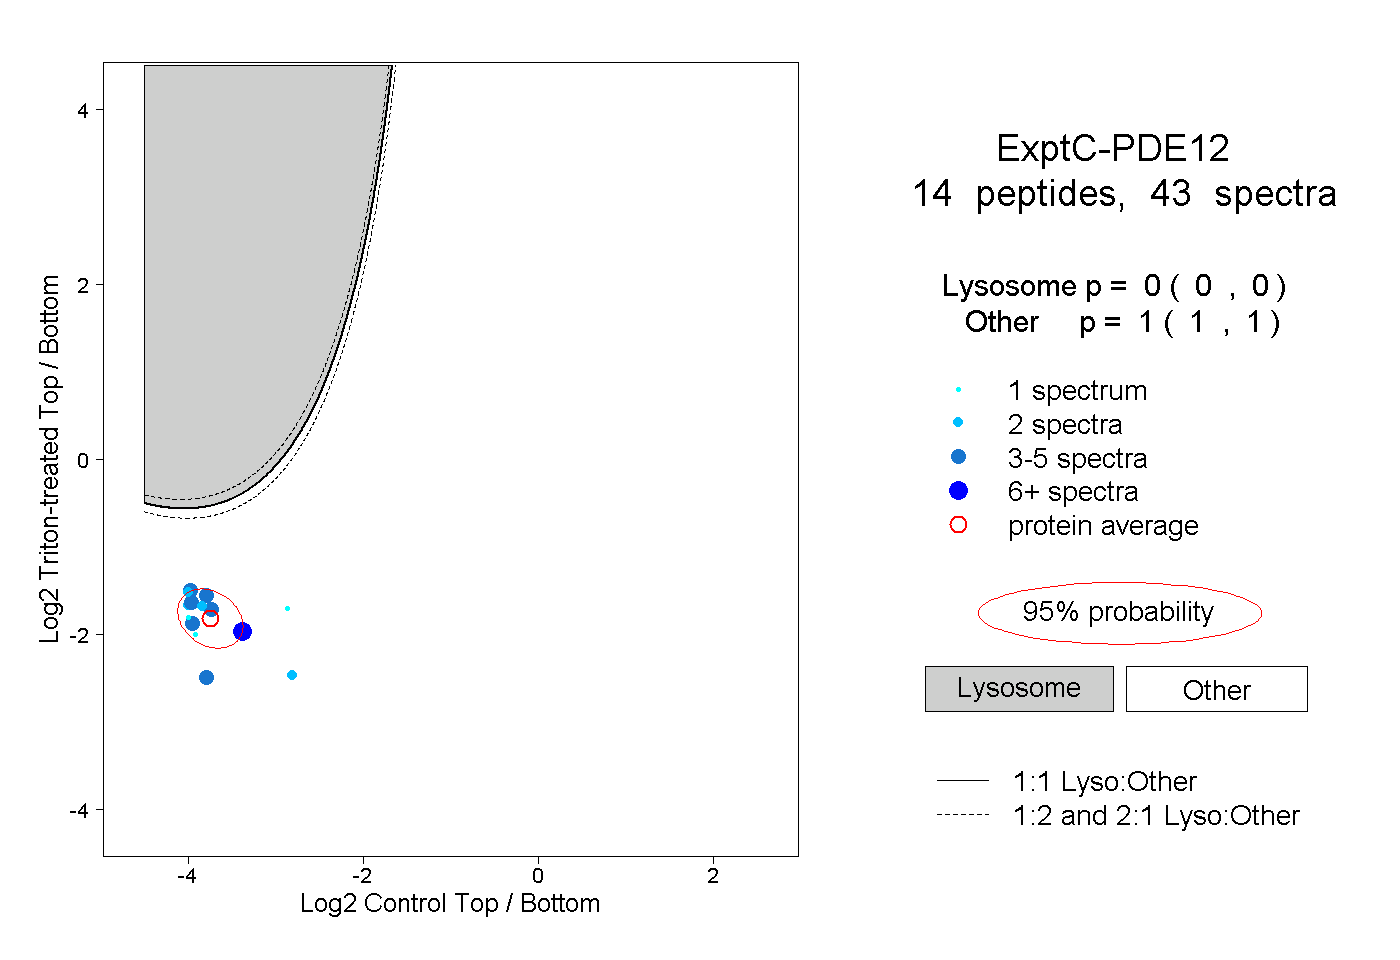
0.000 | 0.000
1.000 | 1.000
4peptides
spectra
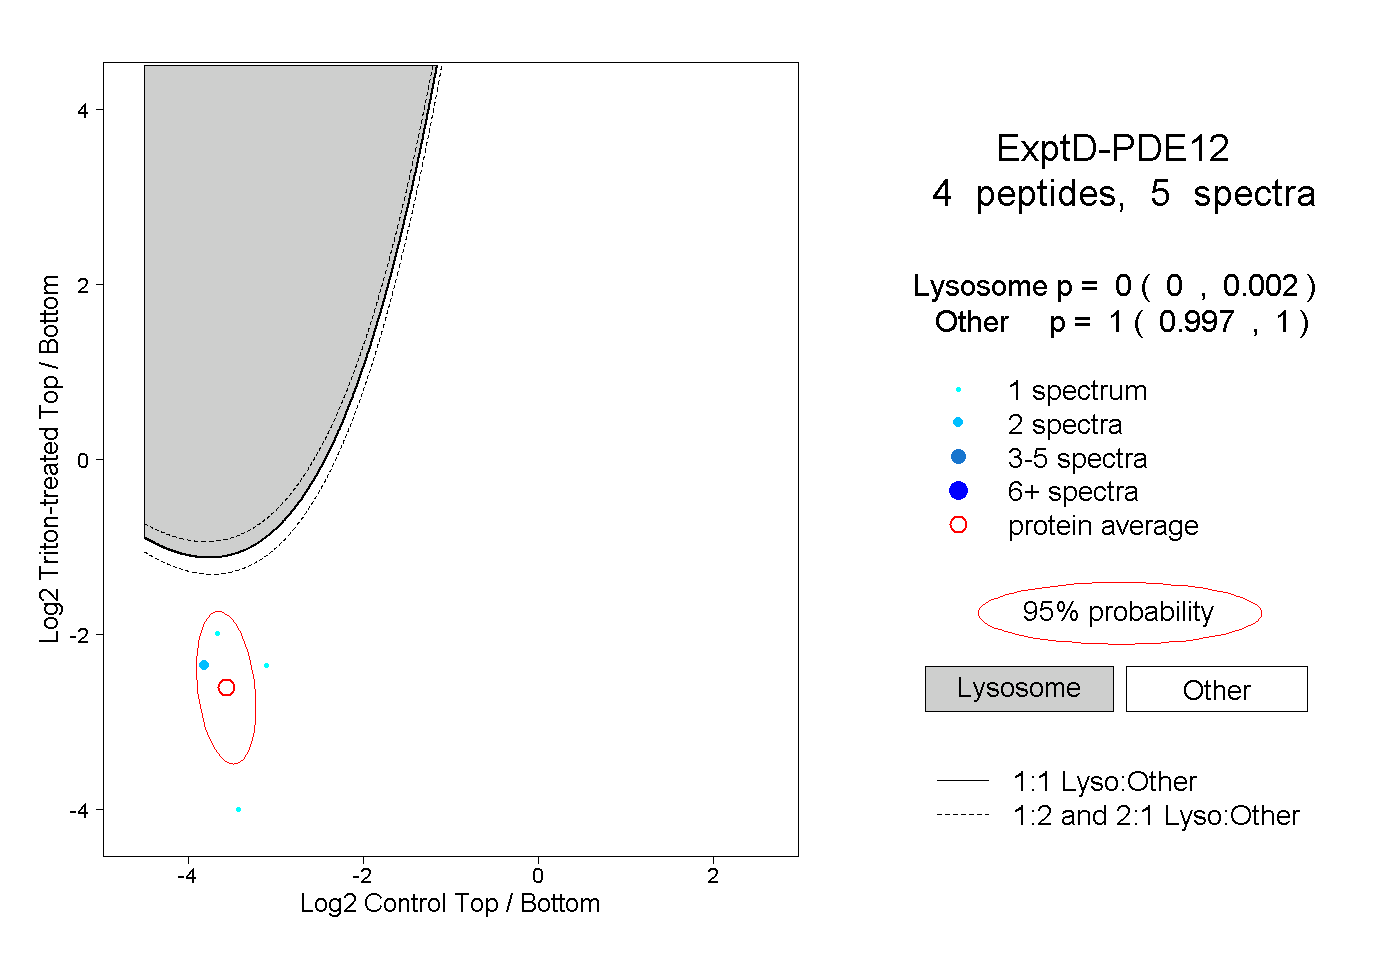
0.000 | 0.002
0.997 | 1.000