6
6peptides
spectra
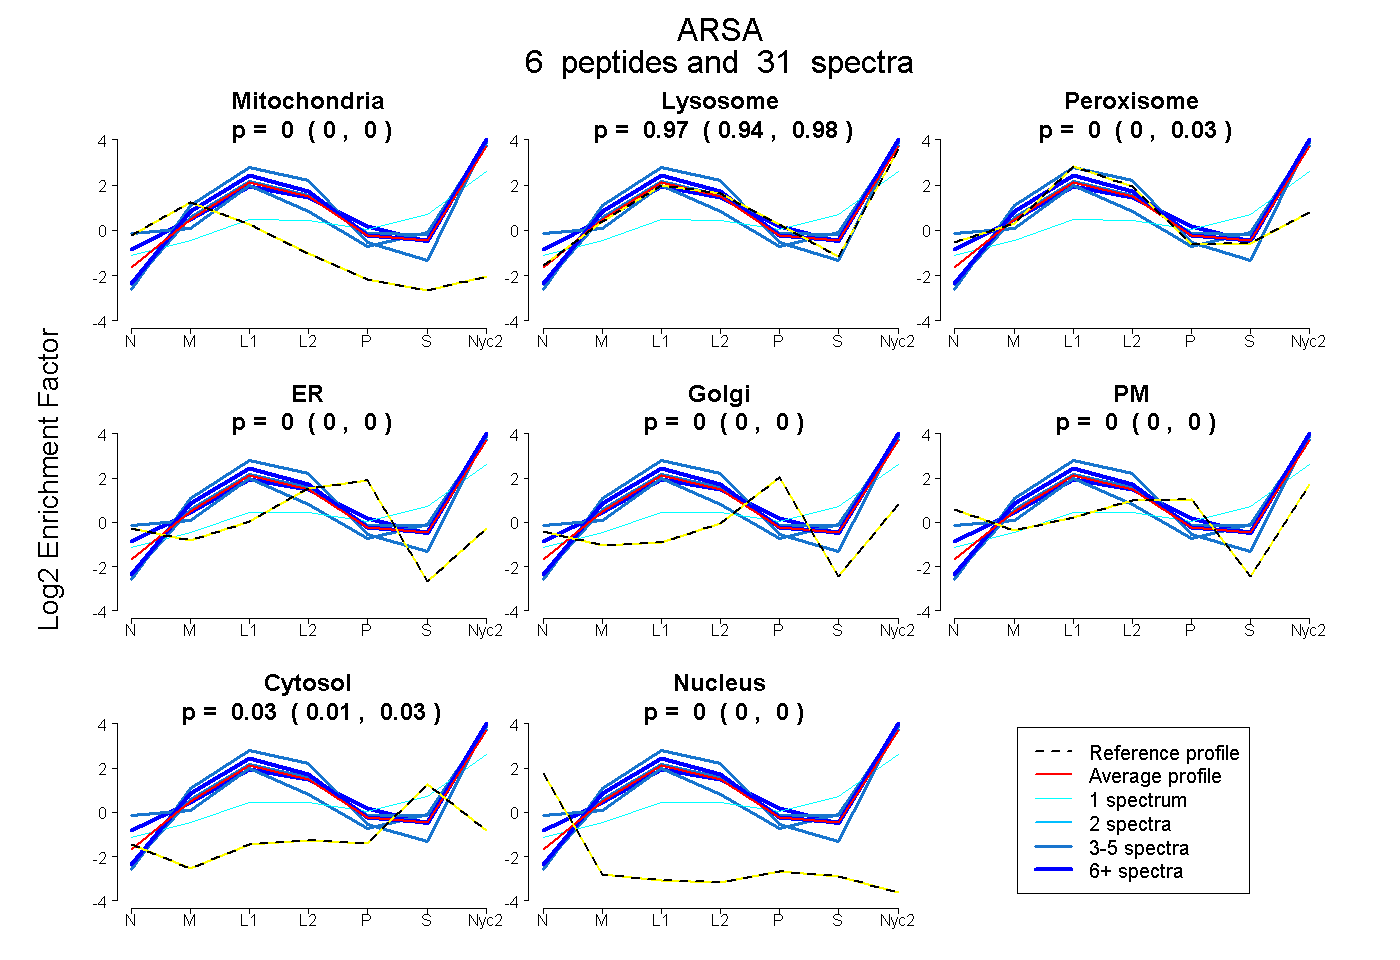
0.000 | 0.000
0.942 | 0.978
0.000 | 0.032
0.000 | 0.000
0.000 | 0.000
0.000 | 0.000
0.014 | 0.034
0.000 | 0.000
5peptides
spectra
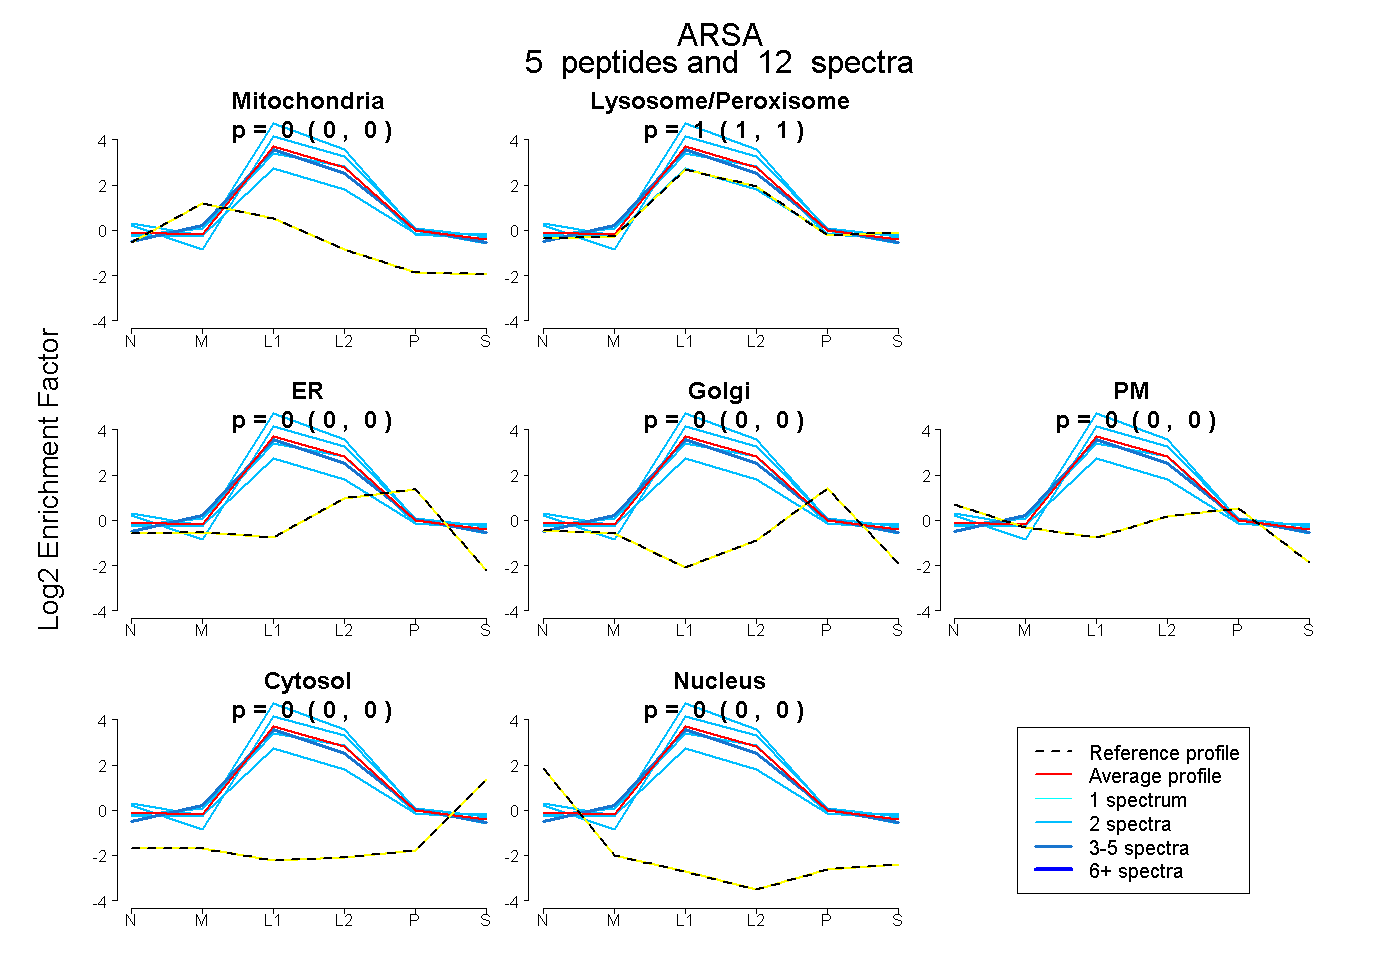
0.000 | 0.000
1.000 | 1.000
0.000 | 0.000
0.000 | 0.000
0.000 | 0.000
0.000 | 0.000
0.000 | 0.000