 6
6peptides
spectra
0.000 | 0.000
0.942 | 0.978
0.000 | 0.032
0.000 | 0.000
0.000 | 0.000
0.000 | 0.000
0.014 | 0.034
0.000 | 0.000
| Plot | Mito | Lyso | Perox | ER | Golgi | PM | Cytosol | Nucleus | |||||
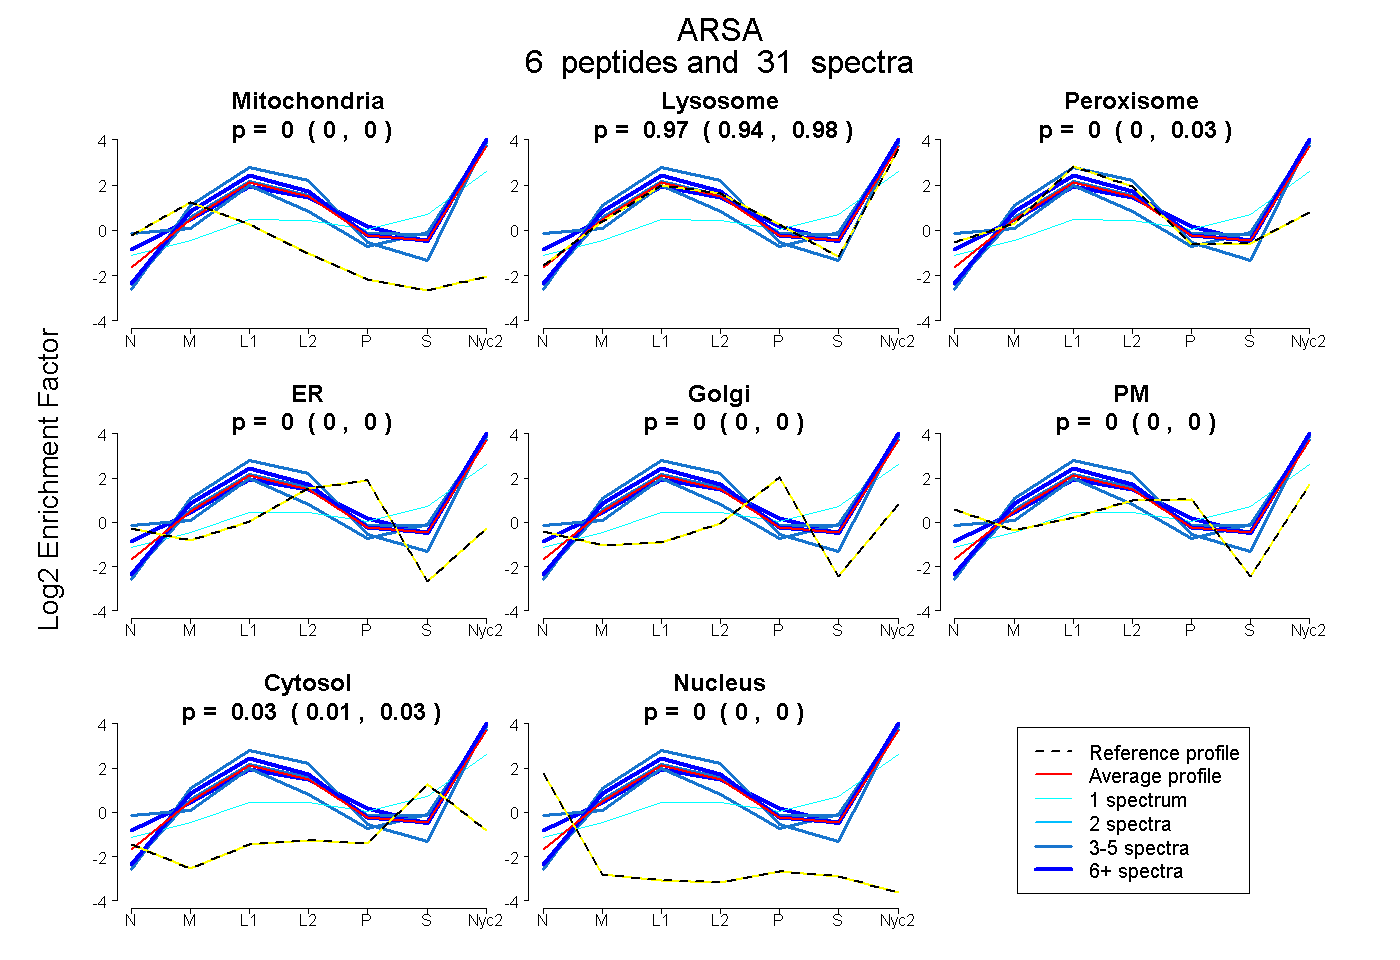
| Expt A |
6 peptides |
31 spectra |
|
0.000 0.000 | 0.000 |
0.969 0.942 | 0.978 |
0.005 0.000 | 0.032 |
0.000 0.000 | 0.000 |
0.000 0.000 | 0.000 |
0.000 0.000 | 0.000 |
0.027 0.014 | 0.034 |
0.000 0.000 | 0.000 |
| 1 spectrum, LTAHEPPLLYDLSK | 0.000 | 0.644 | 0.000 | 0.000 | 0.000 | 0.000 | 0.356 | 0.000 | ||
| 8 spectra, DLMADAQR | 0.000 | 0.990 | 0.000 | 0.000 | 0.000 | 0.000 | 0.010 | 0.000 | ||
| 3 spectra, GYLTGMAGK | 0.000 | 0.840 | 0.063 | 0.000 | 0.000 | 0.000 | 0.097 | 0.000 | ||
| 4 spectra, GTTFEGGVR | 0.000 | 0.980 | 0.000 | 0.000 | 0.000 | 0.000 | 0.020 | 0.000 | ||
| 10 spectra, YVSFSR | 0.000 | 1.000 | 0.000 | 0.000 | 0.000 | 0.000 | 0.000 | 0.000 | ||
| 5 spectra, MSDGGCSGLLR | 0.000 | 1.000 | 0.000 | 0.000 | 0.000 | 0.000 | 0.000 | 0.000 |
| Plot | Mito | Lyso or Perox | ER | Golgi | PM | Cytosol | Nucleus | ||||||
| Expt B |
5 peptides |
12 spectra |
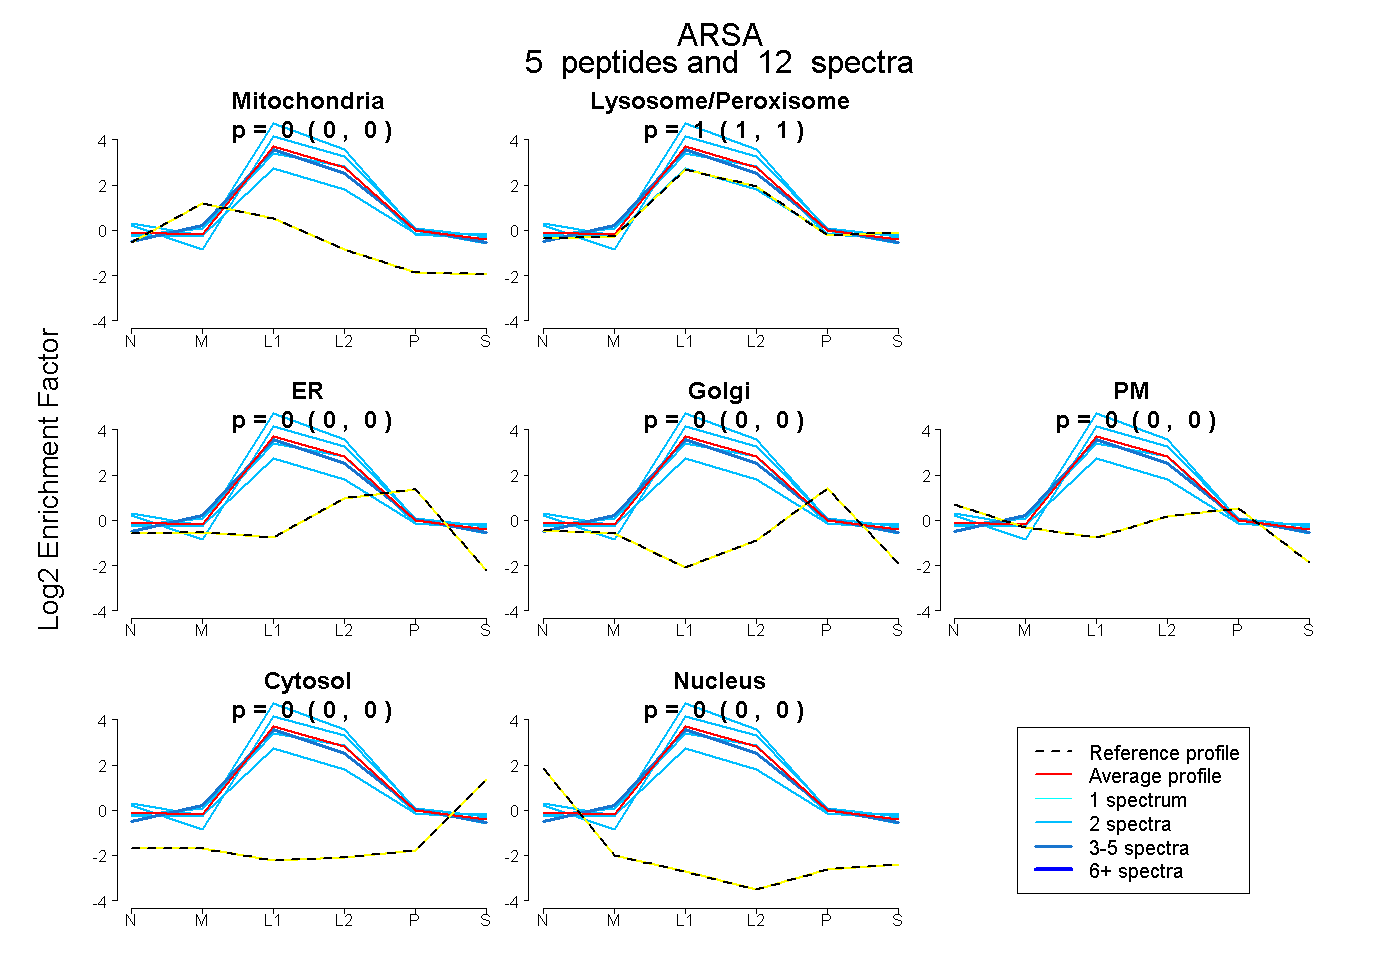 |
0.000 0.000 | 0.000 |
1.000 1.000 | 1.000 |
0.000 0.000 | 0.000 |
0.000 0.000 | 0.000 |
0.000 0.000 | 0.000 |
0.000 0.000 | 0.000 |
0.000 0.000 | 0.000 |
|||
| Plot | Lyso | Other | |||||||||||
| Expt C |
8 peptides |
179 spectra |
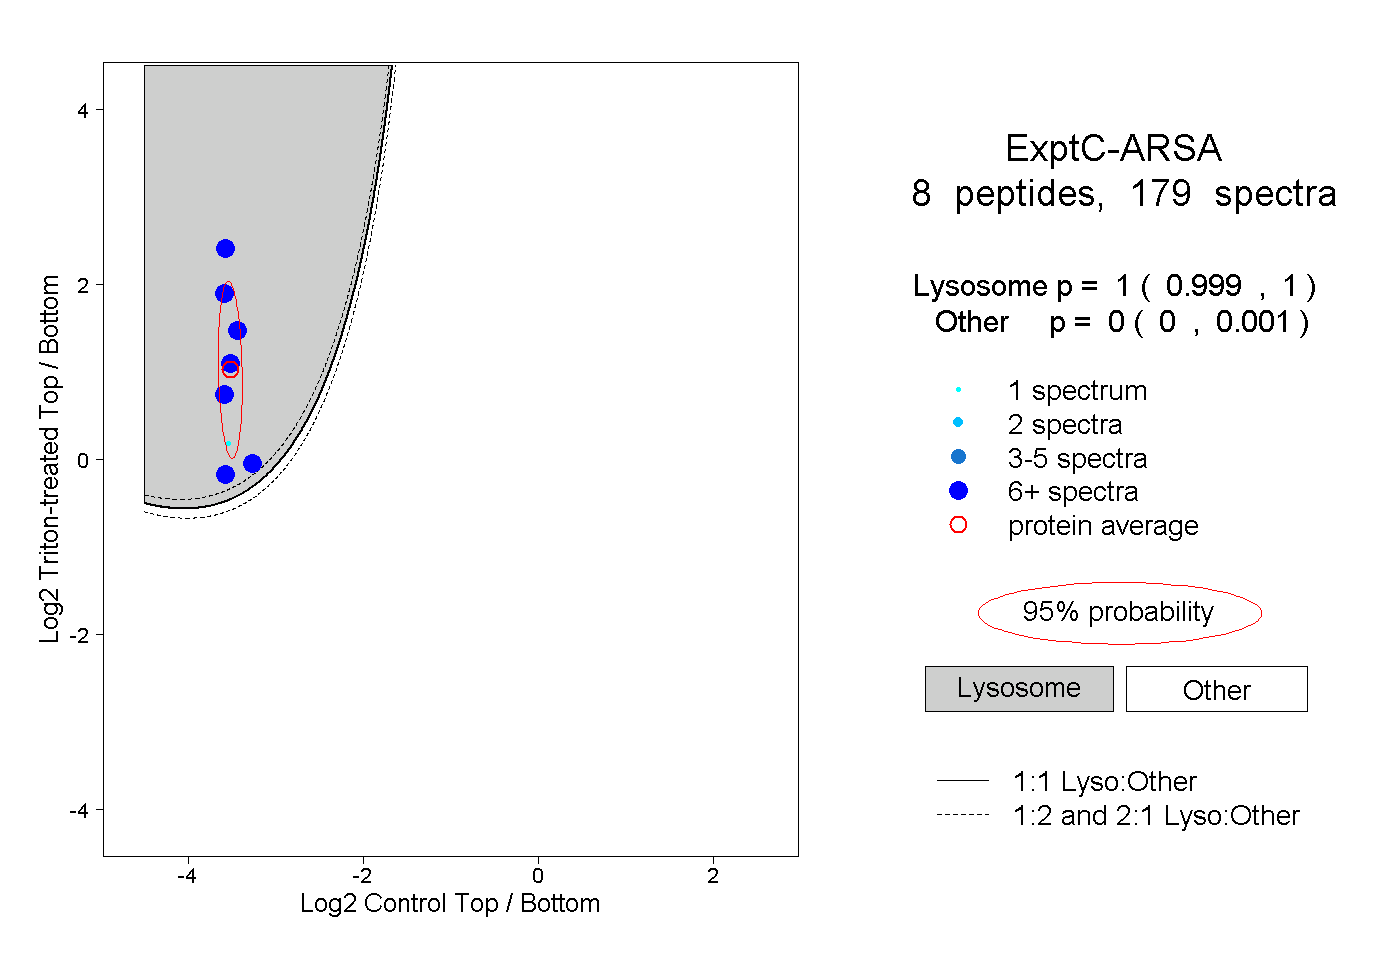 |
1.000 0.999 | 1.000 |
0.000 0.000 | 0.001 |
||||||||
| Plot | Lyso | Other | |||||||||||
| Expt D |
5 peptides |
14 spectra |
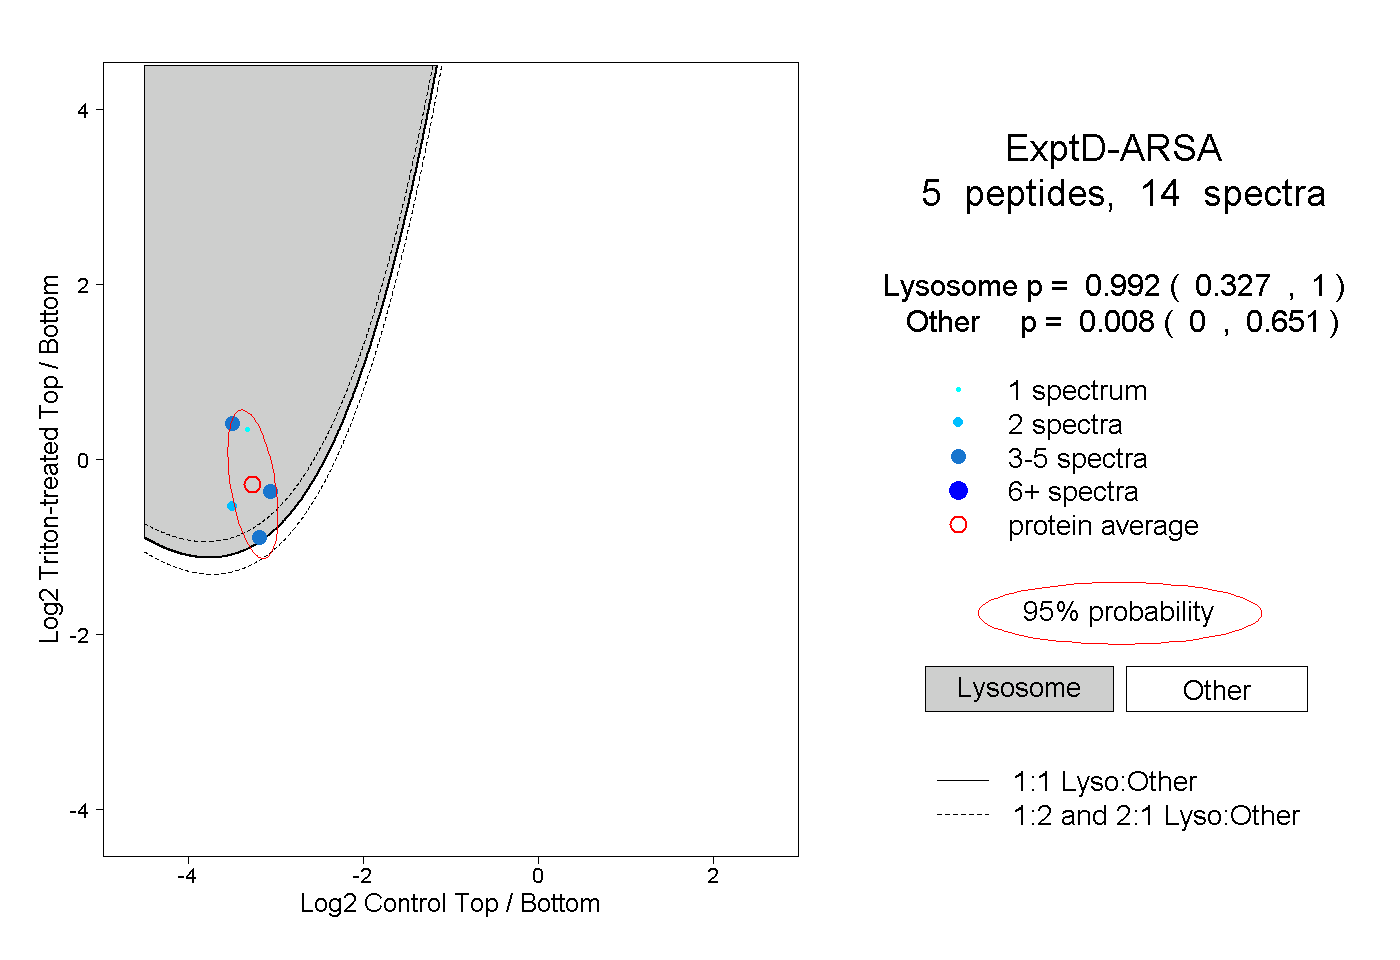 |
0.992 0.327 | 1.000 |
0.008 0.000 | 0.651 |