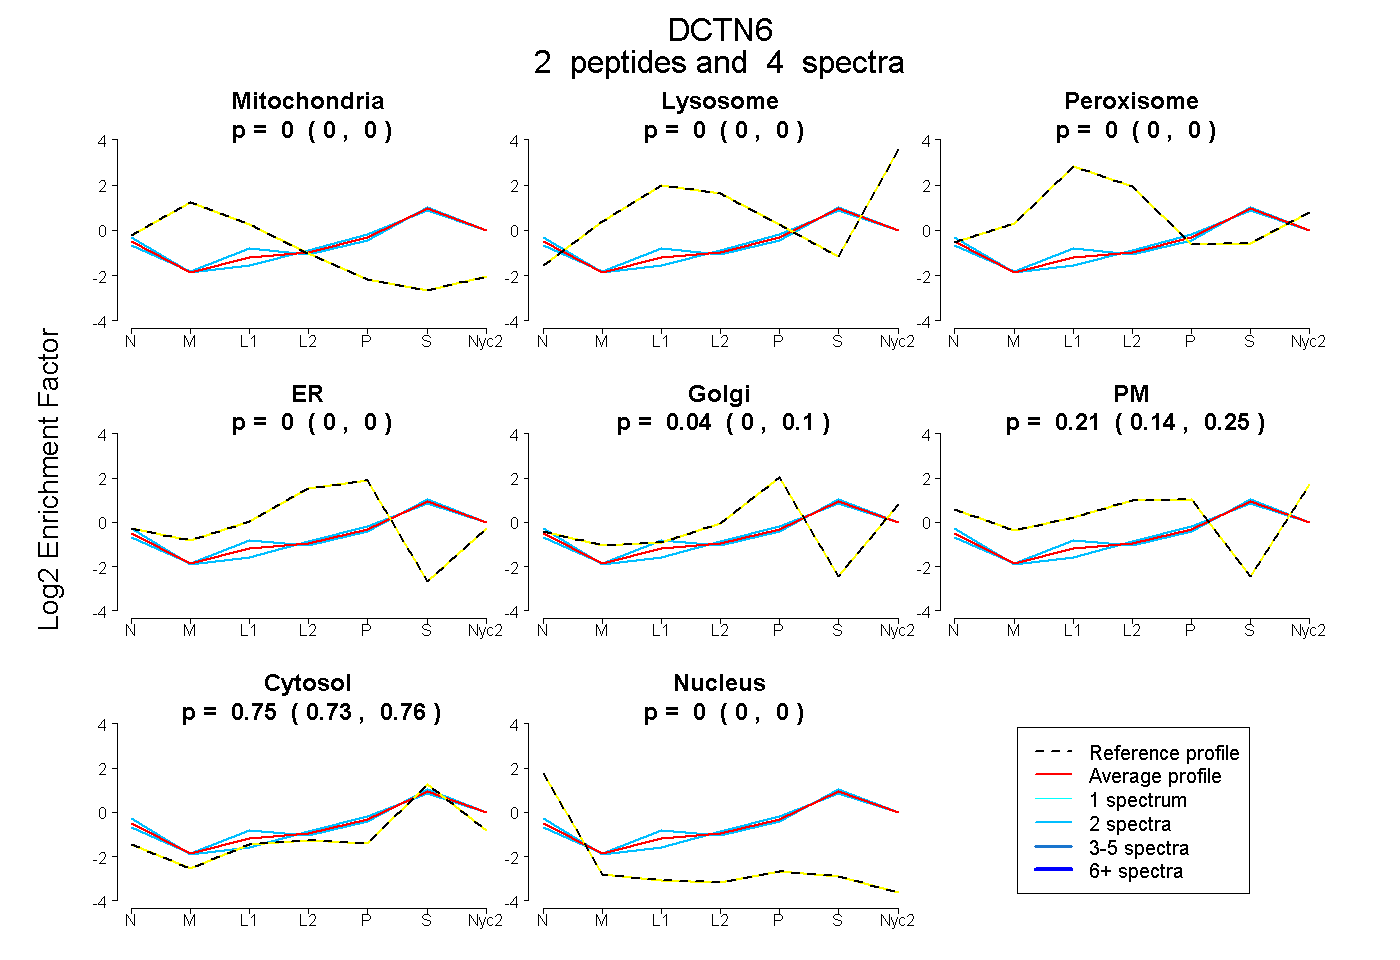
 2
2peptides
spectra
0.000 | 0.000
0.000 | 0.002
0.000 | 0.000
0.000 | 0.000
0.000 | 0.098
0.145 | 0.249
0.733 | 0.764
0.000 | 0.000
| Plot | Mito | Lyso | Perox | ER | Golgi | PM | Cytosol | Nucleus | |||||
| Expt A |
2 peptides |
4 spectra |
|
0.000 0.000 | 0.000 |
0.000 0.000 | 0.002 |
0.000 0.000 | 0.000 |
0.000 0.000 | 0.000 |
0.039 0.000 | 0.098 |
0.211 0.145 | 0.249 |
0.750 0.733 | 0.764 |
0.000 0.000 | 0.000 |
| 2 spectra, ILPNYHHLK | 0.000 | 0.049 | 0.000 | 0.000 | 0.000 | 0.183 | 0.767 | 0.000 | ||
| 2 spectra, TVIHPK | 0.000 | 0.000 | 0.000 | 0.000 | 0.124 | 0.151 | 0.725 | 0.000 |
| Plot | Lyso | Other | |||||||||||
| Expt C |
1 peptide |
2 spectra |
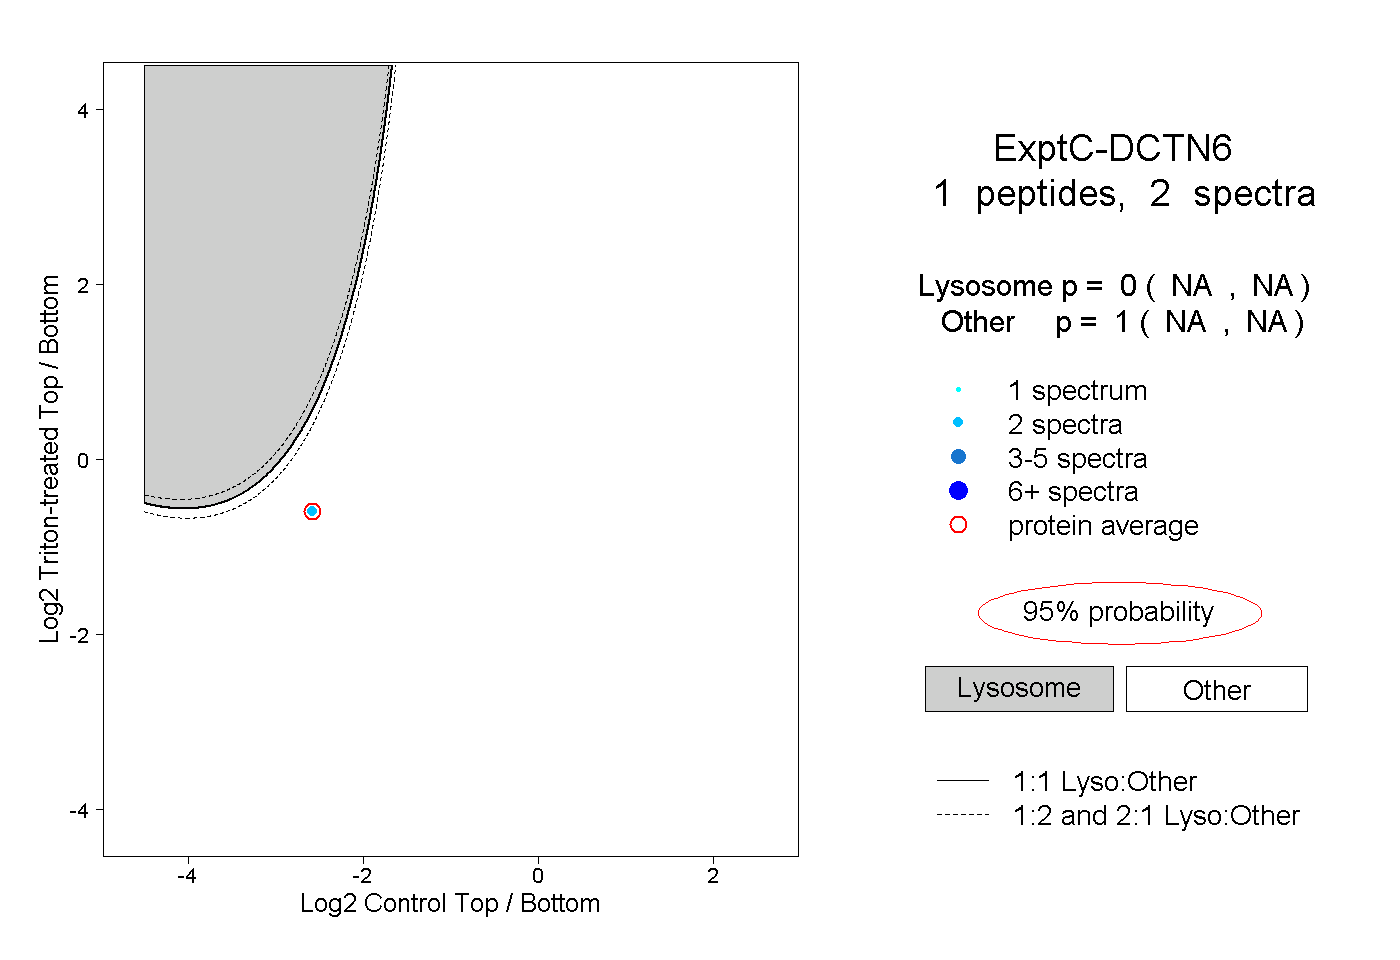 |
0.000 NA | NA |
1.000 NA | NA |