 1
1peptide
spectra
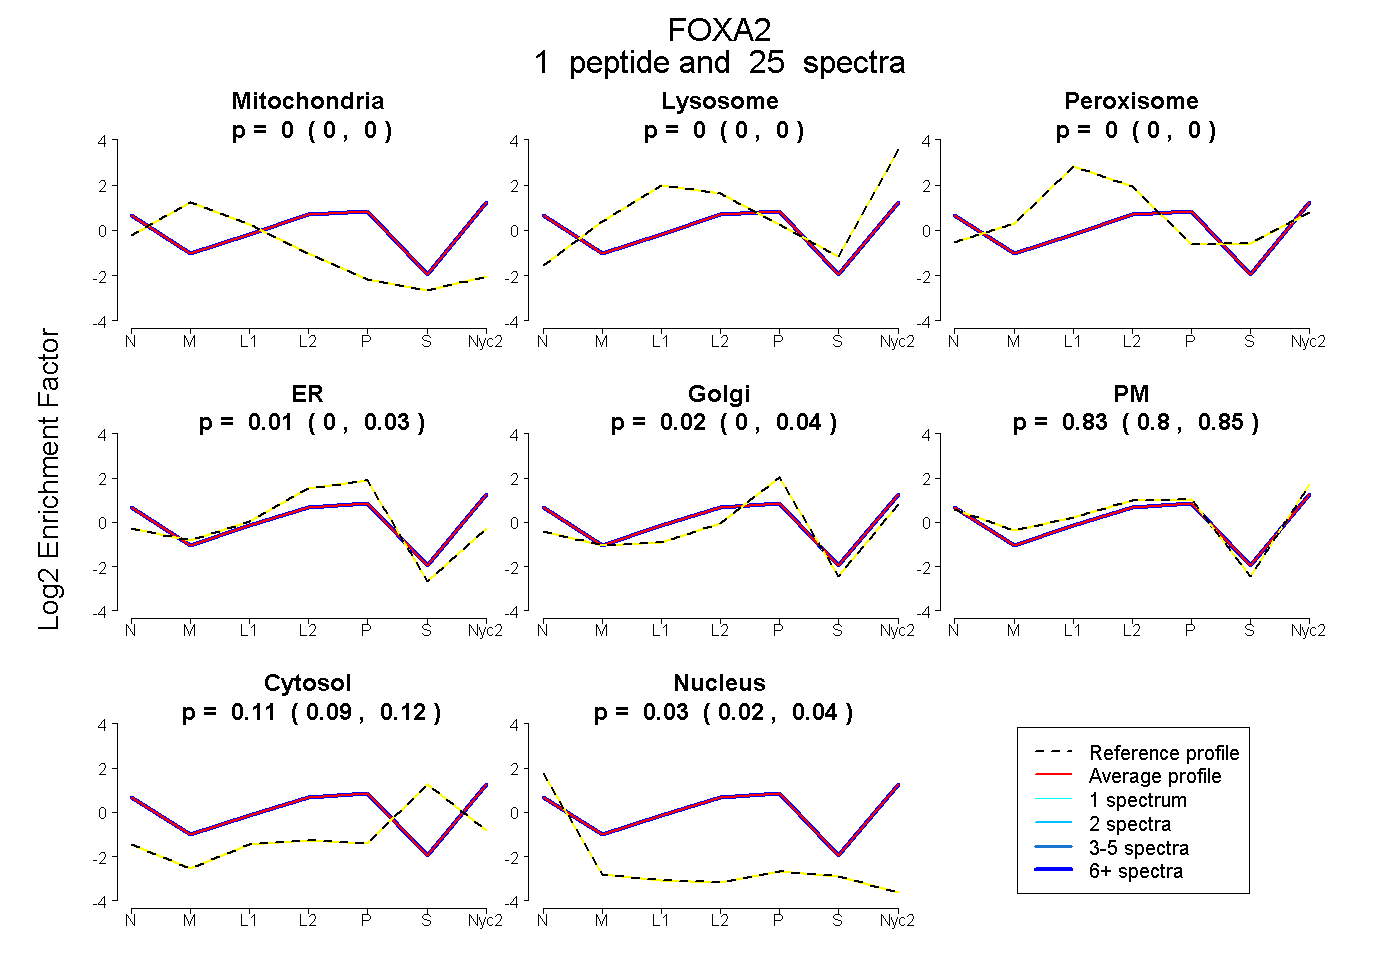
0.000 | 0.000
0.000 | 0.000
0.000 | 0.000
0.000 | 0.030
0.000 | 0.041
0.805 | 0.848
0.089 | 0.125
0.023 | 0.044
2peptides
spectra
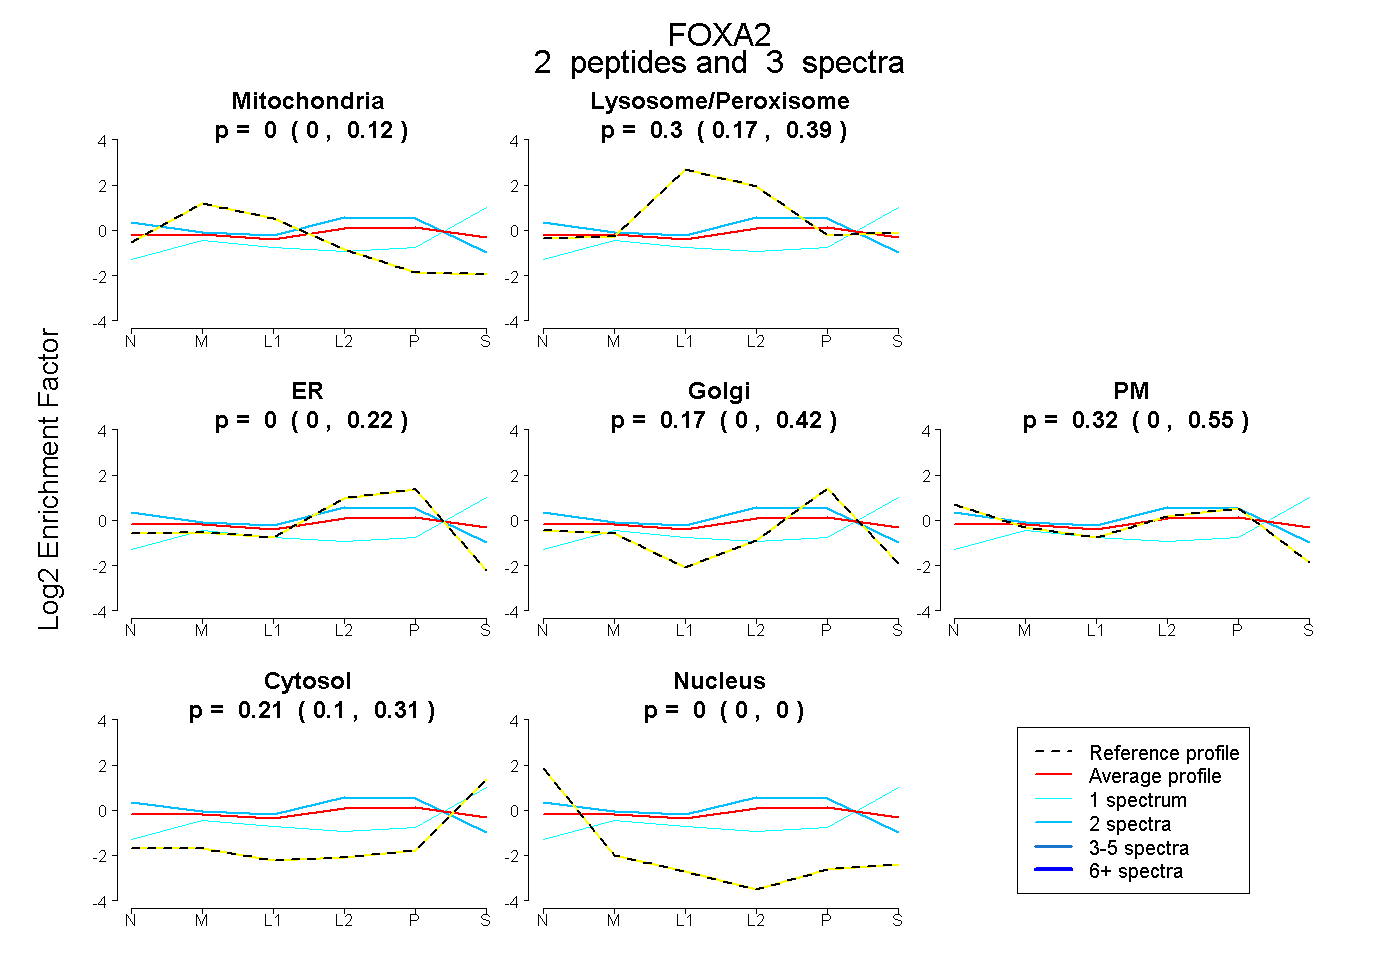
0.000 | 0.118
0.167 | 0.394
0.000 | 0.224
0.000 | 0.418
0.000 | 0.555
0.099 | 0.308
0.000 | 0.000
1peptide
spectra
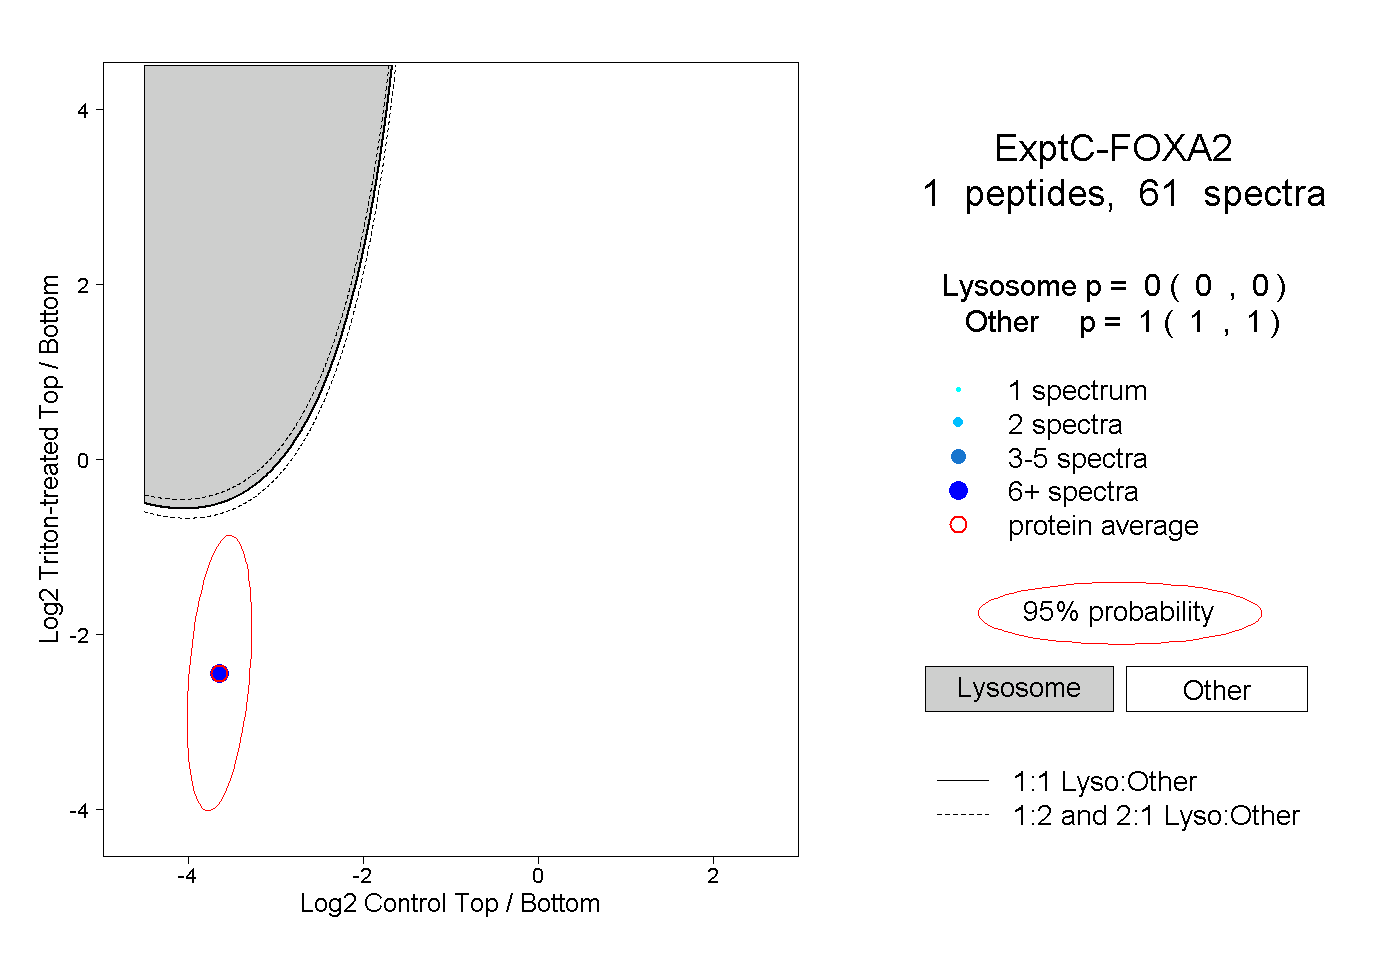
0.000 | 0.000
1.000 | 1.000