 3
3peptides
spectra
0.000 | 0.048
0.000 | 0.000
0.000 | 0.091
0.280 | 0.507
0.000 | 0.316
0.104 | 0.399
0.026 | 0.220
0.000 | 0.052
| Plot | Mito | Lyso | Perox | ER | Golgi | PM | Cytosol | Nucleus | |||||
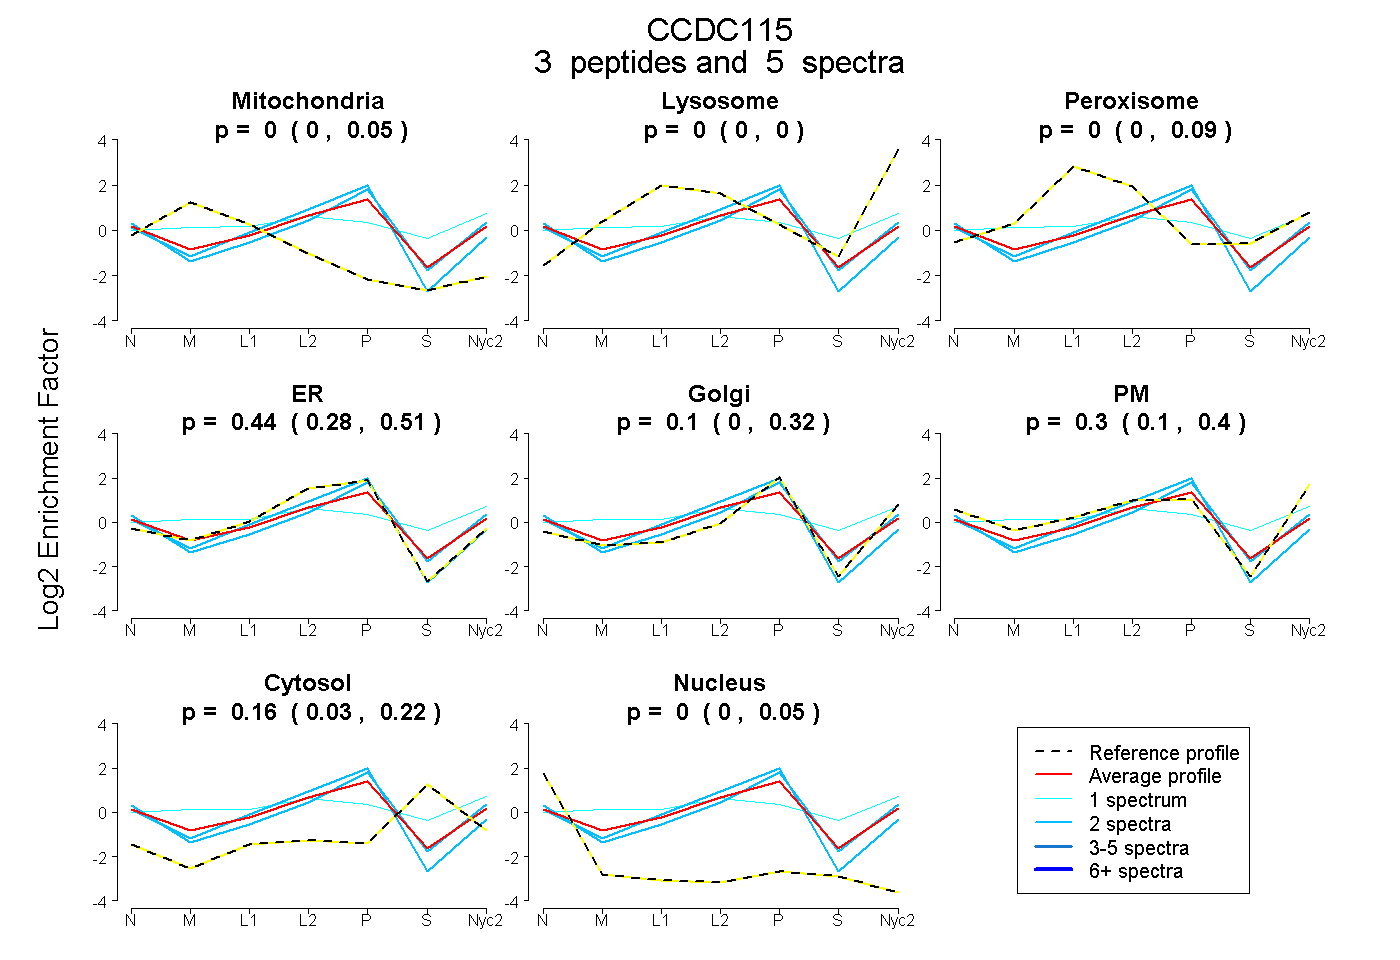
| Expt A |
3 peptides |
5 spectra |
|
0.000 0.000 | 0.048 |
0.000 0.000 | 0.000 |
0.000 0.000 | 0.091 |
0.437 0.280 | 0.507 |
0.096 0.000 | 0.316 |
0.303 0.104 | 0.399 |
0.160 0.026 | 0.220 |
0.004 0.000 | 0.052 |
| 1 spectrum, ANAQIPEEVGPSEASLR | 0.016 | 0.000 | 0.277 | 0.000 | 0.033 | 0.438 | 0.236 | 0.000 | ||
| 2 spectra, INWGLSQLR | 0.000 | 0.000 | 0.000 | 0.782 | 0.166 | 0.000 | 0.000 | 0.052 | ||
| 2 spectra, VEEGWLSLAK | 0.000 | 0.000 | 0.000 | 0.290 | 0.434 | 0.157 | 0.101 | 0.017 |
| Plot | Mito | Lyso or Perox | ER | Golgi | PM | Cytosol | Nucleus | ||||||
| Expt B |
3 peptides |
4 spectra |
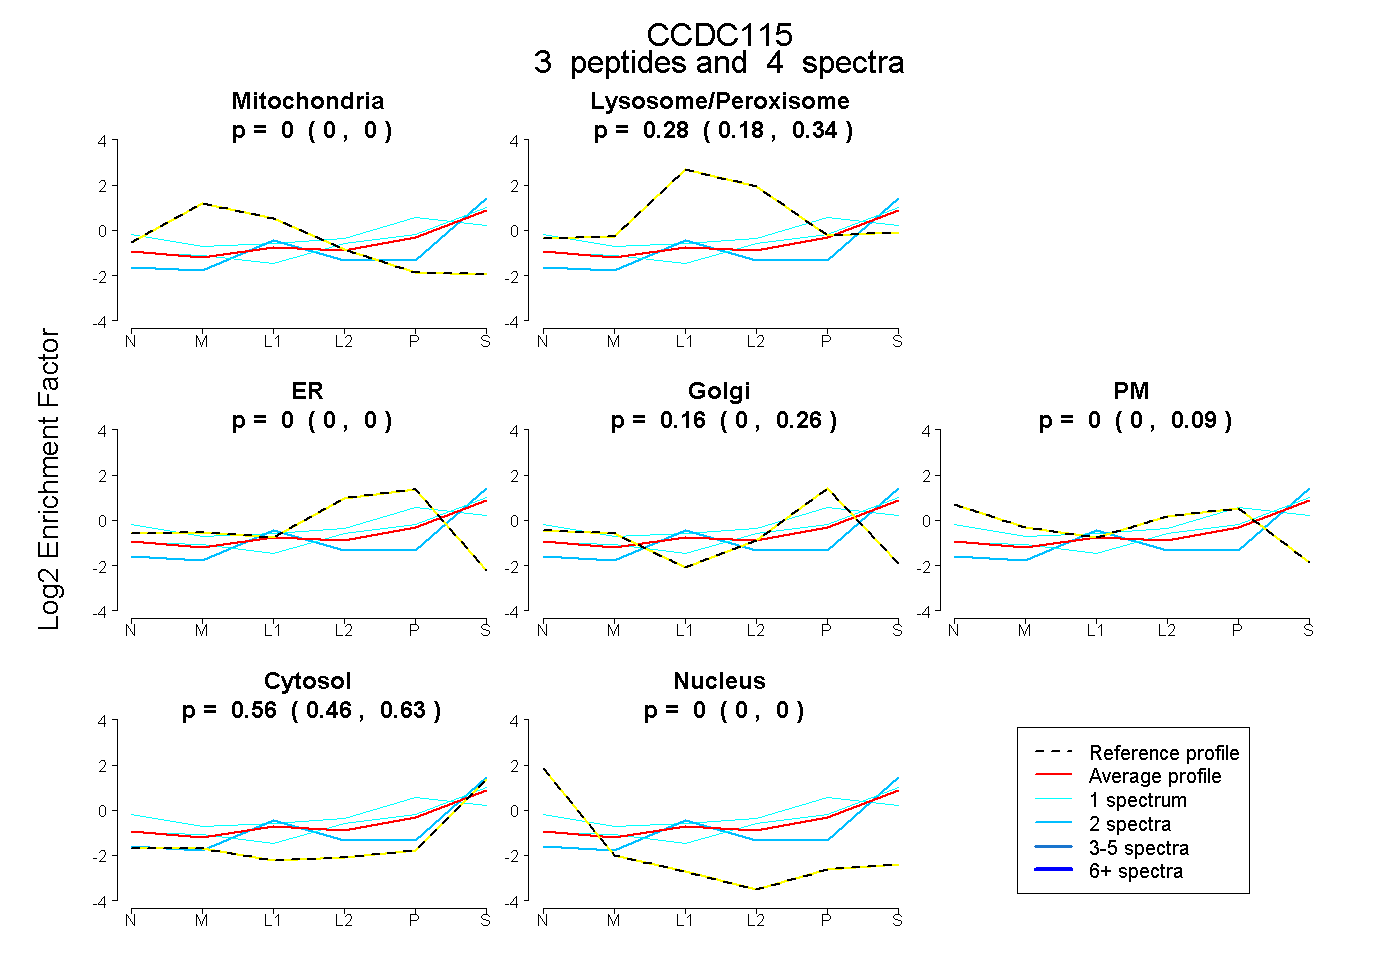 |
0.000 0.000 | 0.000 |
0.280 0.184 | 0.344 |
0.000 0.000 | 0.000 |
0.164 0.000 | 0.261 |
0.000 0.000 | 0.094 |
0.555 0.463 | 0.634 |
0.000 0.000 | 0.000 |
|||
| Plot | Lyso | Other | |||||||||||
| Expt C |
3 peptides |
5 spectra |
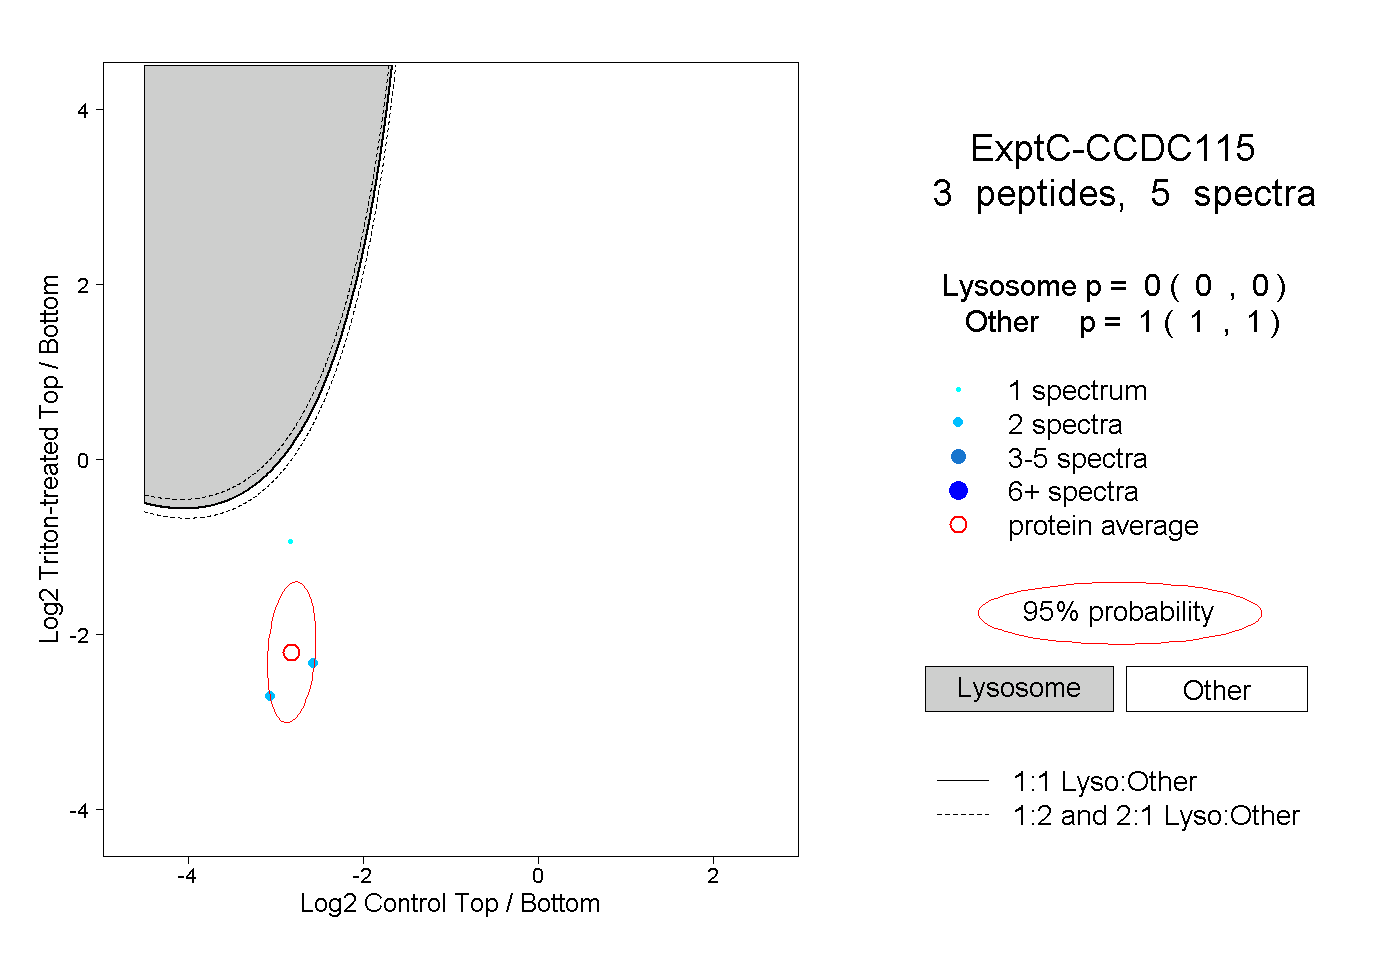 |
0.000 0.000 | 0.000 |
1.000 1.000 | 1.000 |