 9
9peptides
spectra
0.000 | 0.000
0.533 | 0.574
0.000 | 0.000
0.000 | 0.000
0.155 | 0.215
0.212 | 0.294
0.000 | 0.000
0.000 | 0.000
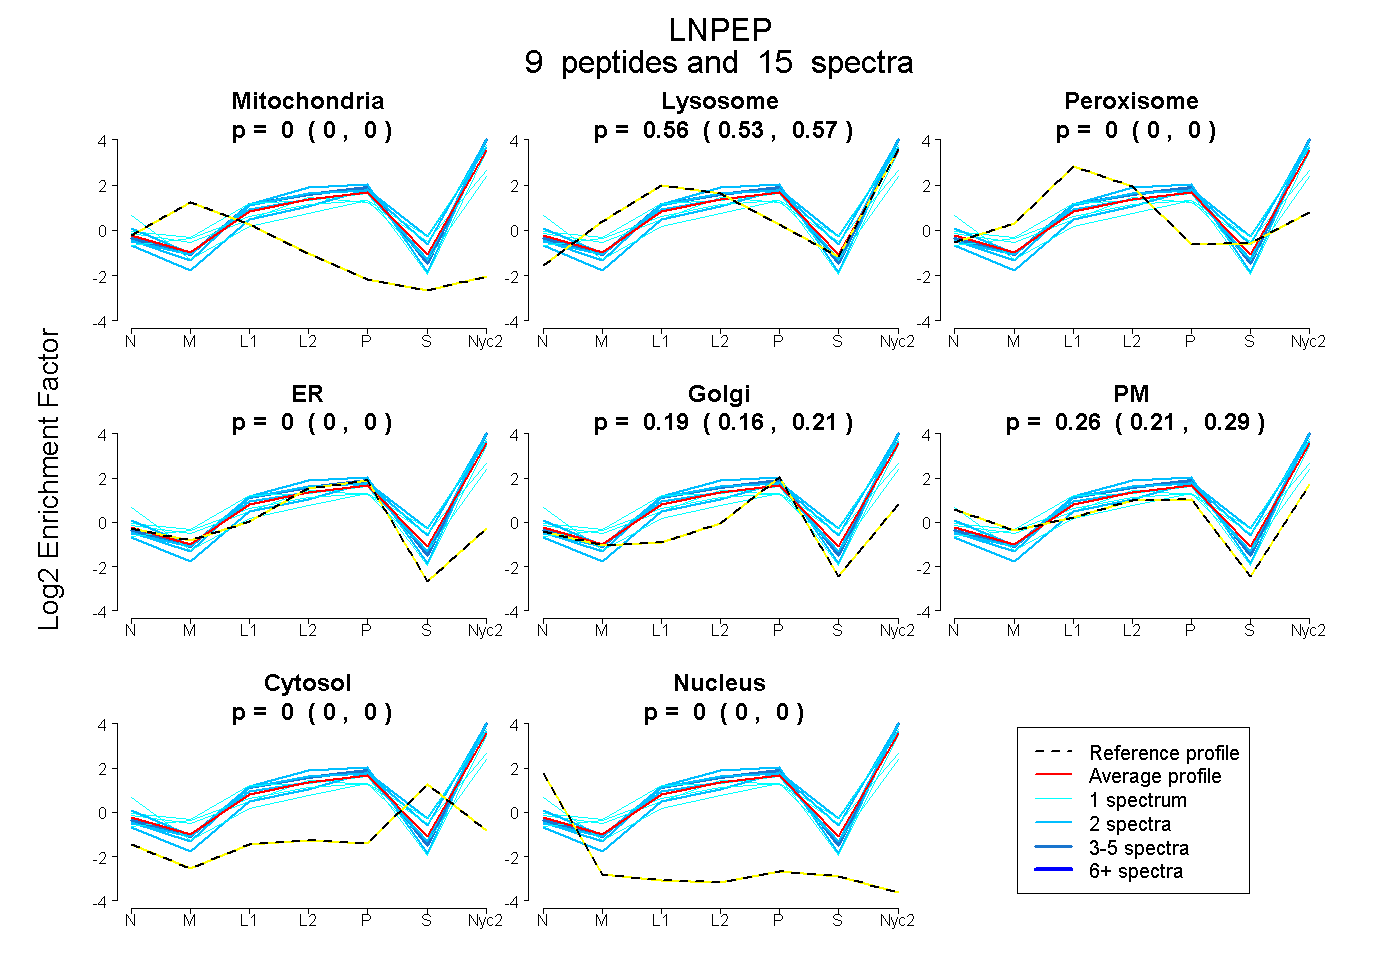
| Plot | Mito | Lyso | Perox | ER | Golgi | PM | Cytosol | Nucleus | |||||
| Expt A |
9 peptides |
15 spectra |
|
0.000 0.000 | 0.000 |
0.556 0.533 | 0.574 |
0.000 0.000 | 0.000 |
0.000 0.000 | 0.000 |
0.188 0.155 | 0.215 |
0.256 0.212 | 0.294 |
0.000 0.000 | 0.000 |
0.000 0.000 | 0.000 |
| 1 spectrum, NFAATQFEPLAAR | 0.000 | 0.734 | 0.000 | 0.000 | 0.224 | 0.000 | 0.042 | 0.000 | ||
| 2 spectra, SSLDGDIIR | 0.000 | 0.515 | 0.000 | 0.000 | 0.015 | 0.470 | 0.000 | 0.000 | ||
| 2 spectra, LPTAIIPQR | 0.000 | 0.595 | 0.000 | 0.000 | 0.333 | 0.000 | 0.072 | 0.000 | ||
| 1 spectrum, LGHMDLSSR | 0.000 | 0.454 | 0.000 | 0.000 | 0.040 | 0.410 | 0.097 | 0.000 | ||
| 2 spectra, GFPLVTVQR | 0.000 | 0.595 | 0.000 | 0.000 | 0.091 | 0.314 | 0.000 | 0.000 | ||
| 1 spectrum, SAFPCFDEPAFK | 0.000 | 0.474 | 0.000 | 0.000 | 0.000 | 0.526 | 0.000 | 0.000 | ||
| 1 spectrum, NSATGYR | 0.000 | 0.109 | 0.000 | 0.000 | 0.020 | 0.778 | 0.093 | 0.000 | ||
| 3 spectra, ELNSYEDFLDAR | 0.000 | 0.609 | 0.000 | 0.000 | 0.121 | 0.270 | 0.000 | 0.000 | ||
| 2 spectra, GTELLLQQER | 0.000 | 0.718 | 0.000 | 0.000 | 0.205 | 0.077 | 0.000 | 0.000 |
| Plot | Mito | Lyso or Perox | ER | Golgi | PM | Cytosol | Nucleus | ||||||
| Expt B |
2 peptides |
2 spectra |
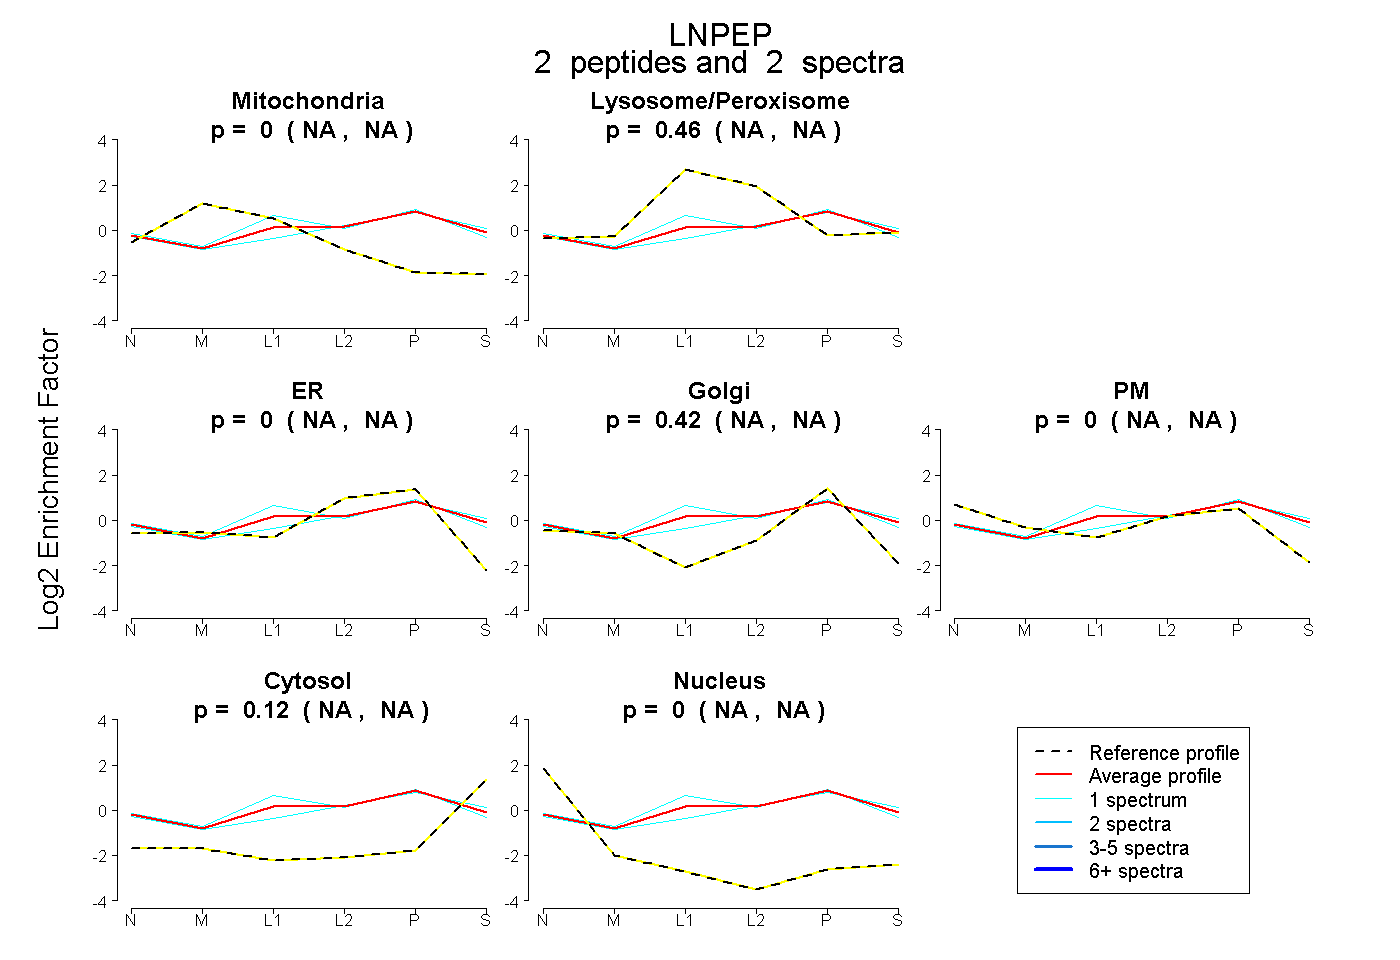 |
0.000 NA | NA |
0.459 NA | NA |
0.000 NA | NA |
0.421 NA | NA |
0.000 NA | NA |
0.120 NA | NA |
0.000 NA | NA |
|||
| Plot | Lyso | Other | |||||||||||
| Expt C |
10 peptides |
35 spectra |
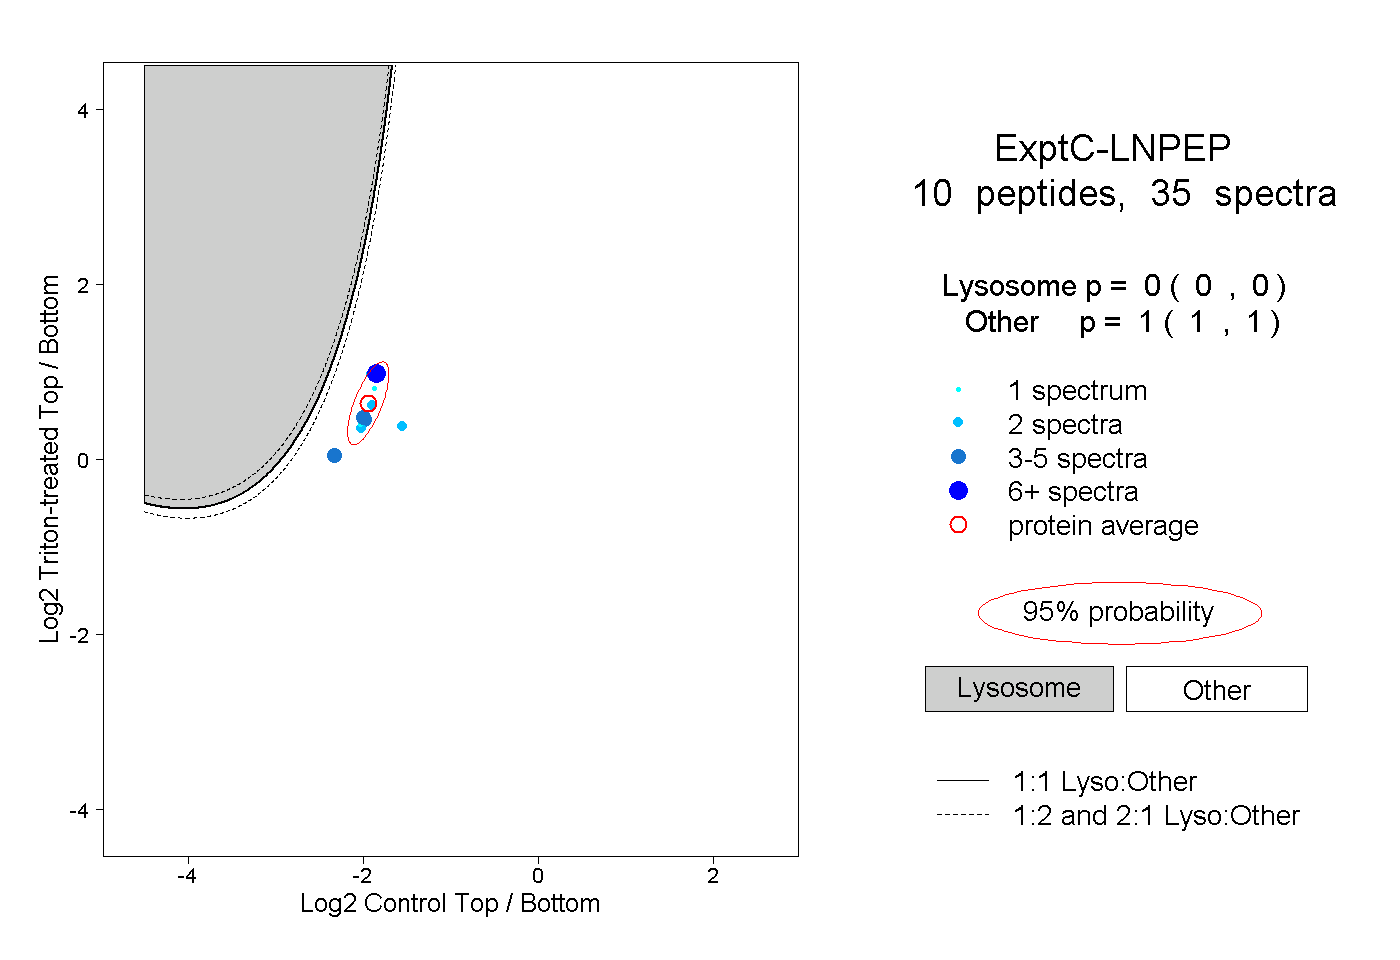 |
0.000 0.000 | 0.000 |
1.000 1.000 | 1.000 |
||||||||
| Plot | Lyso | Other | |||||||||||
| Expt D |
2 peptides |
2 spectra |
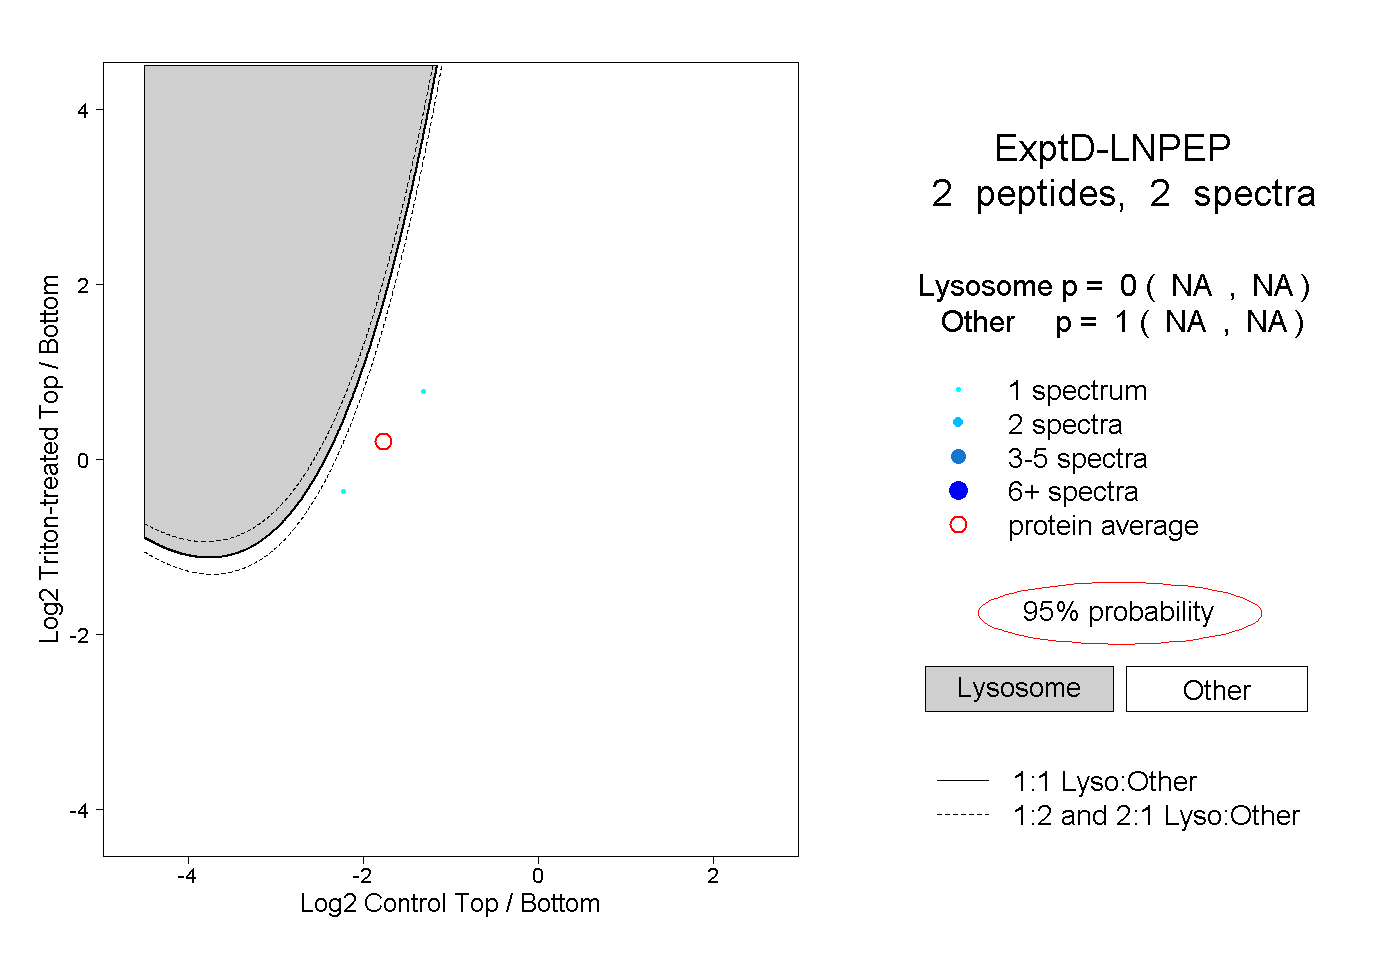 |
0.000 NA | NA |
1.000 NA | NA |