 2
2peptides
spectra
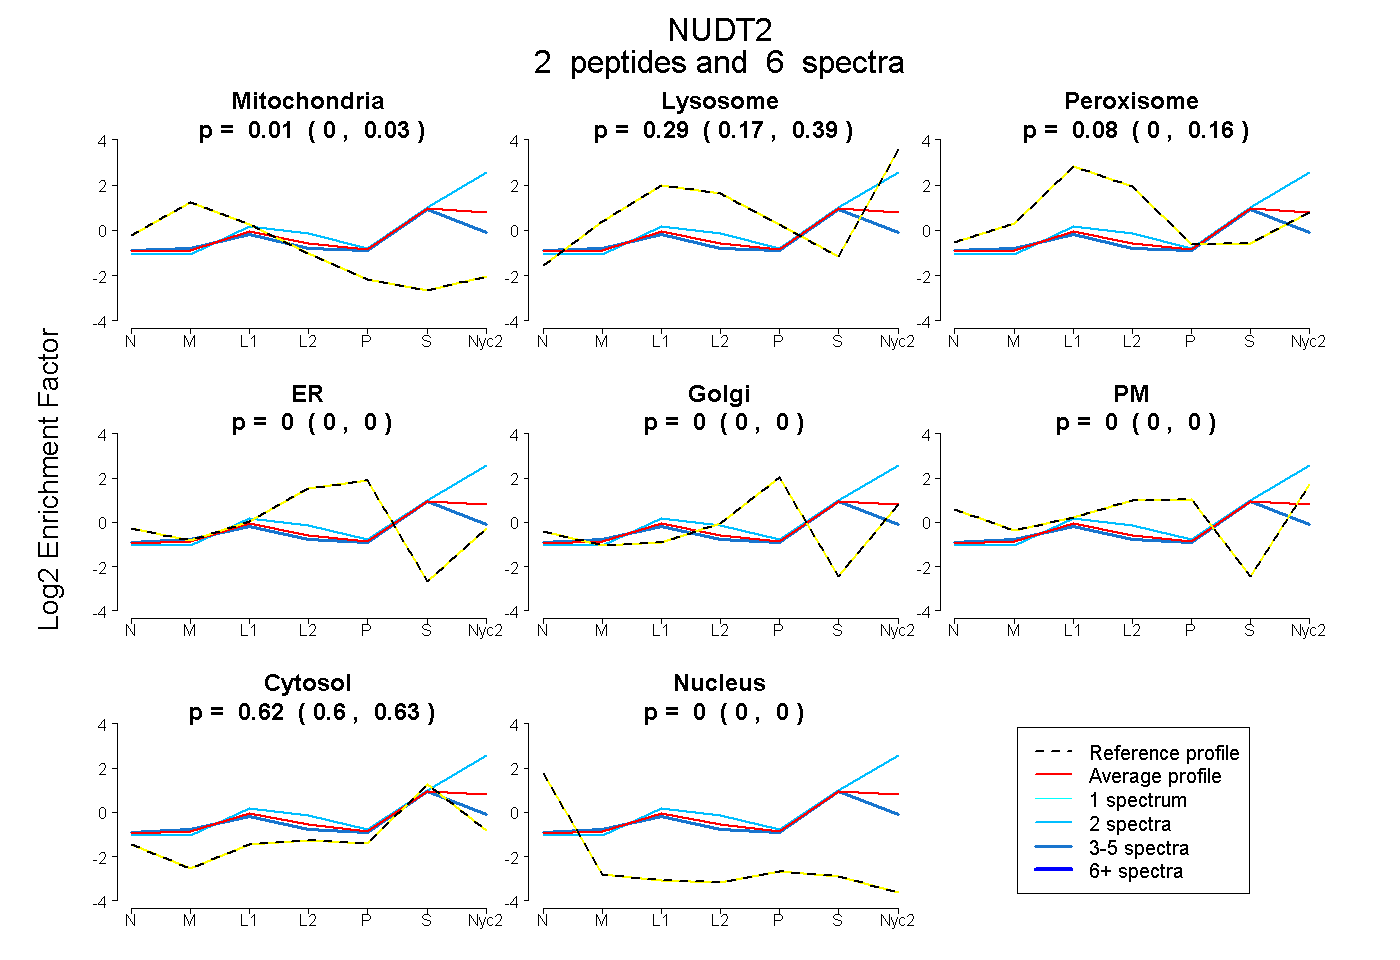
0.000 | 0.033
0.173 | 0.386
0.000 | 0.161
0.000 | 0.000
0.000 | 0.000
0.000 | 0.000
0.596 | 0.634
0.000 | 0.000
1peptide
spectra
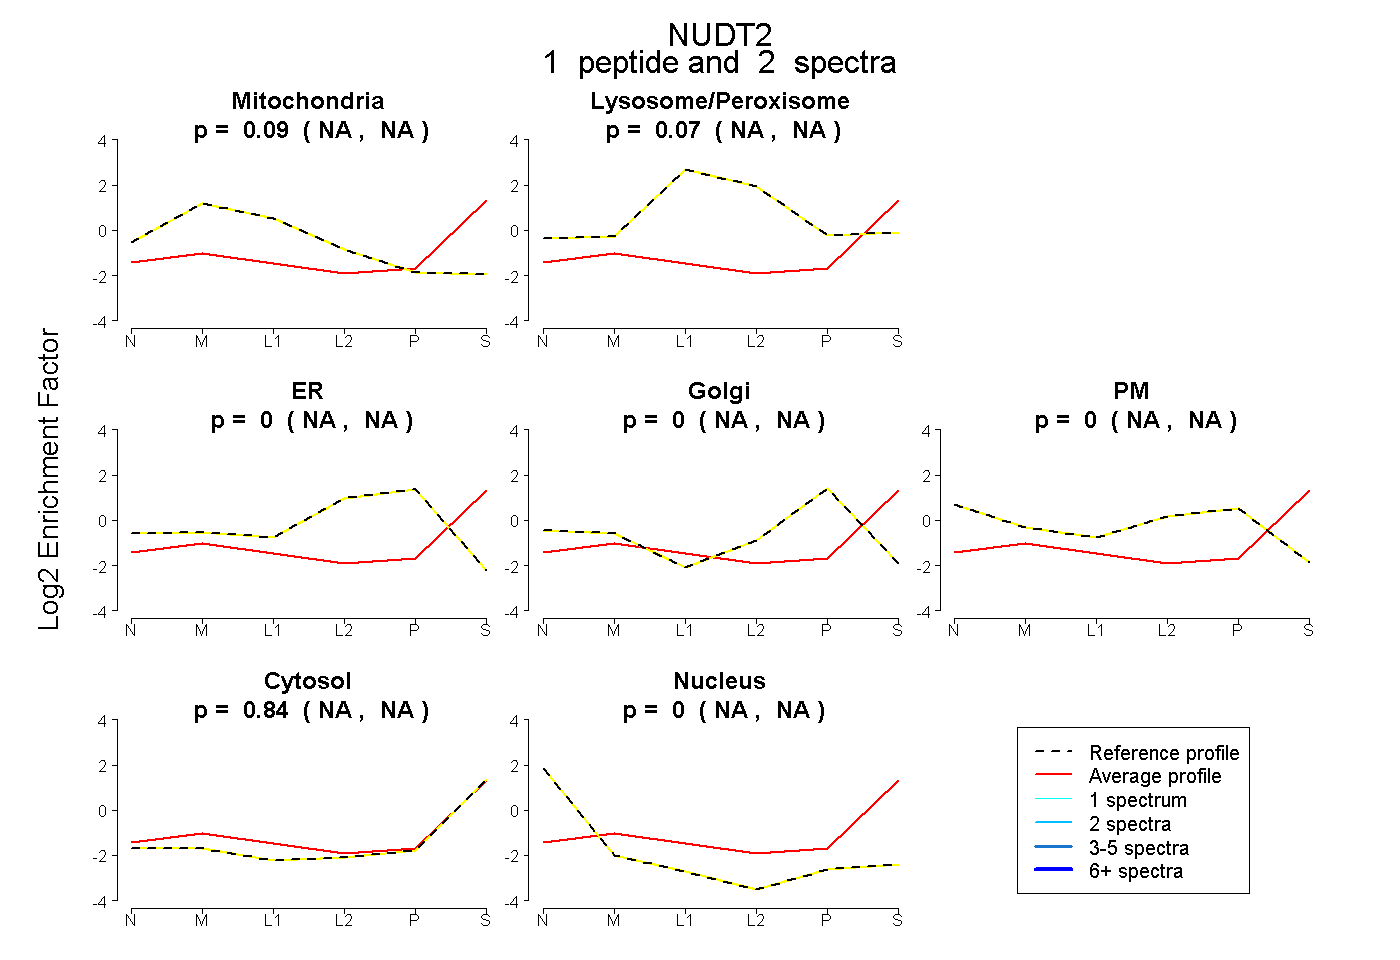
NA | NA
NA | NA
NA | NA
NA | NA
NA | NA
NA | NA
NA | NA
2peptides
spectra
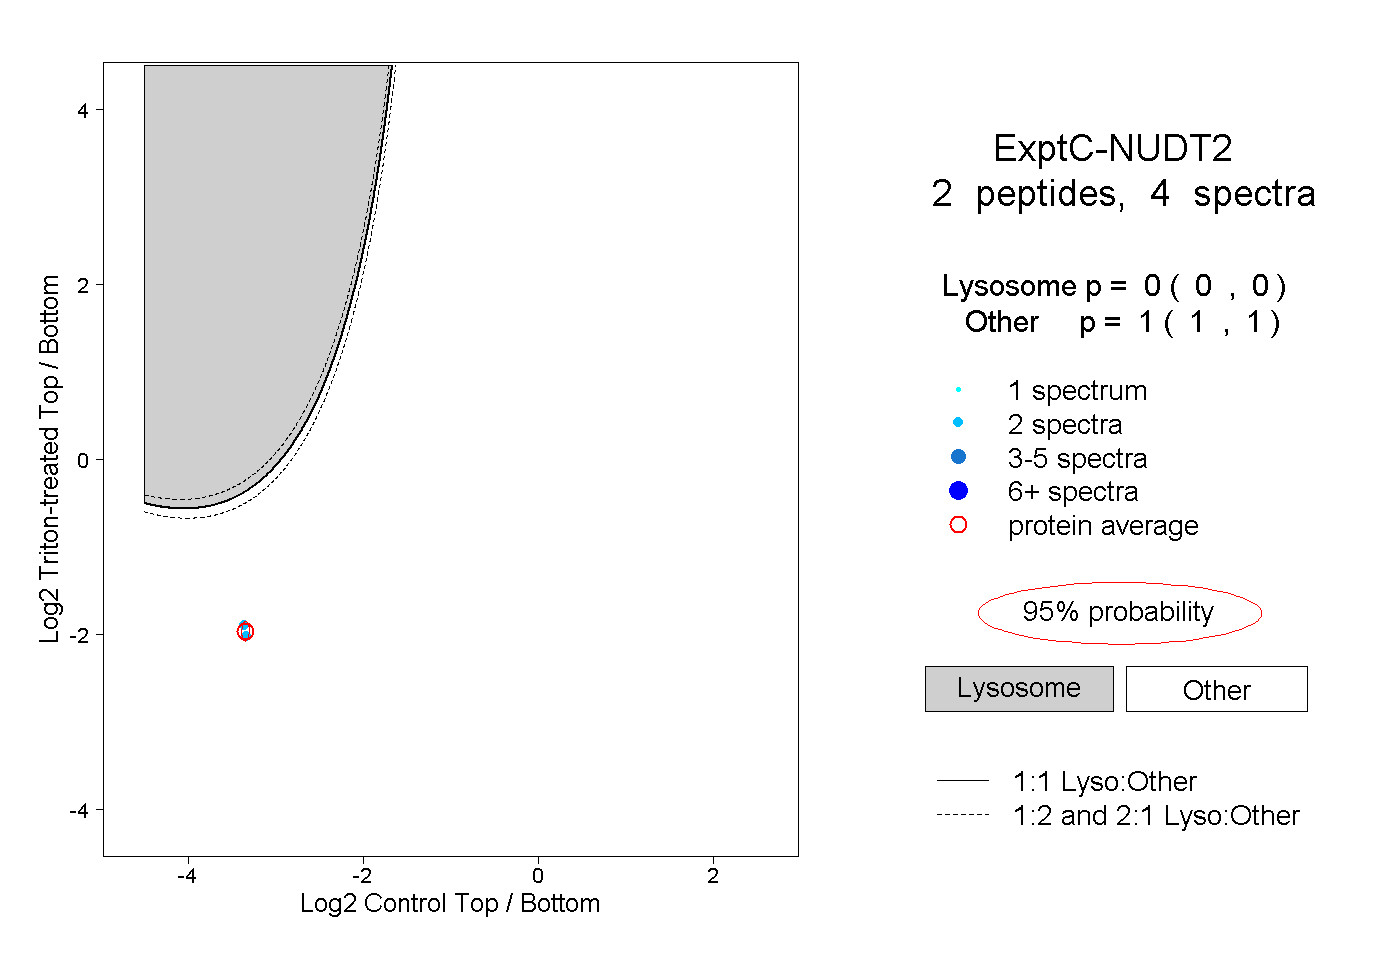
0.000 | 0.000
1.000 | 1.000
1peptide
spectrum
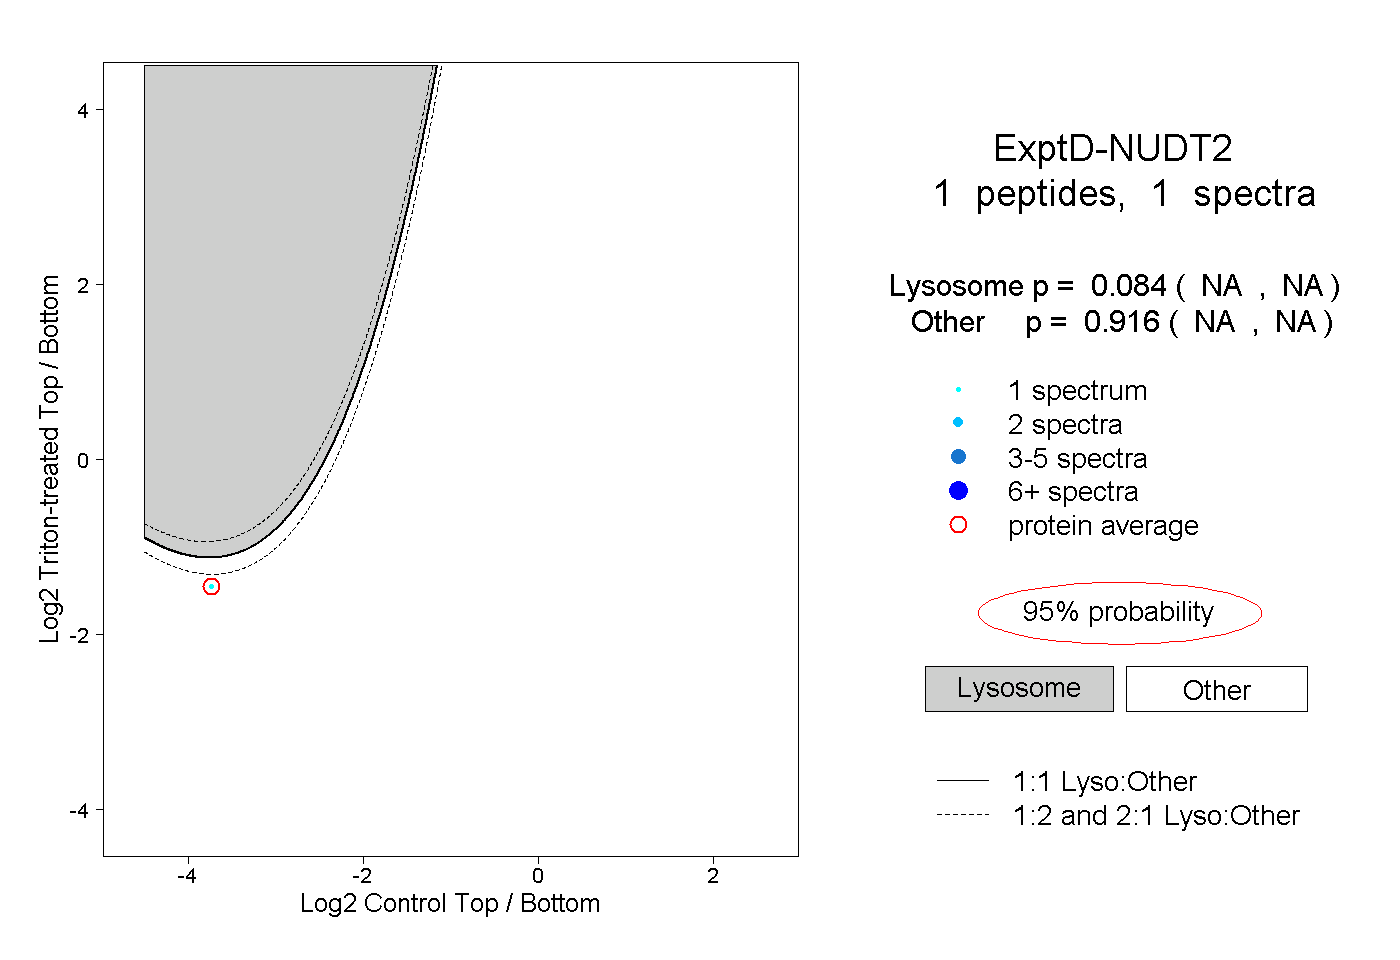
NA | NA
NA | NA