 2
2peptides
spectra
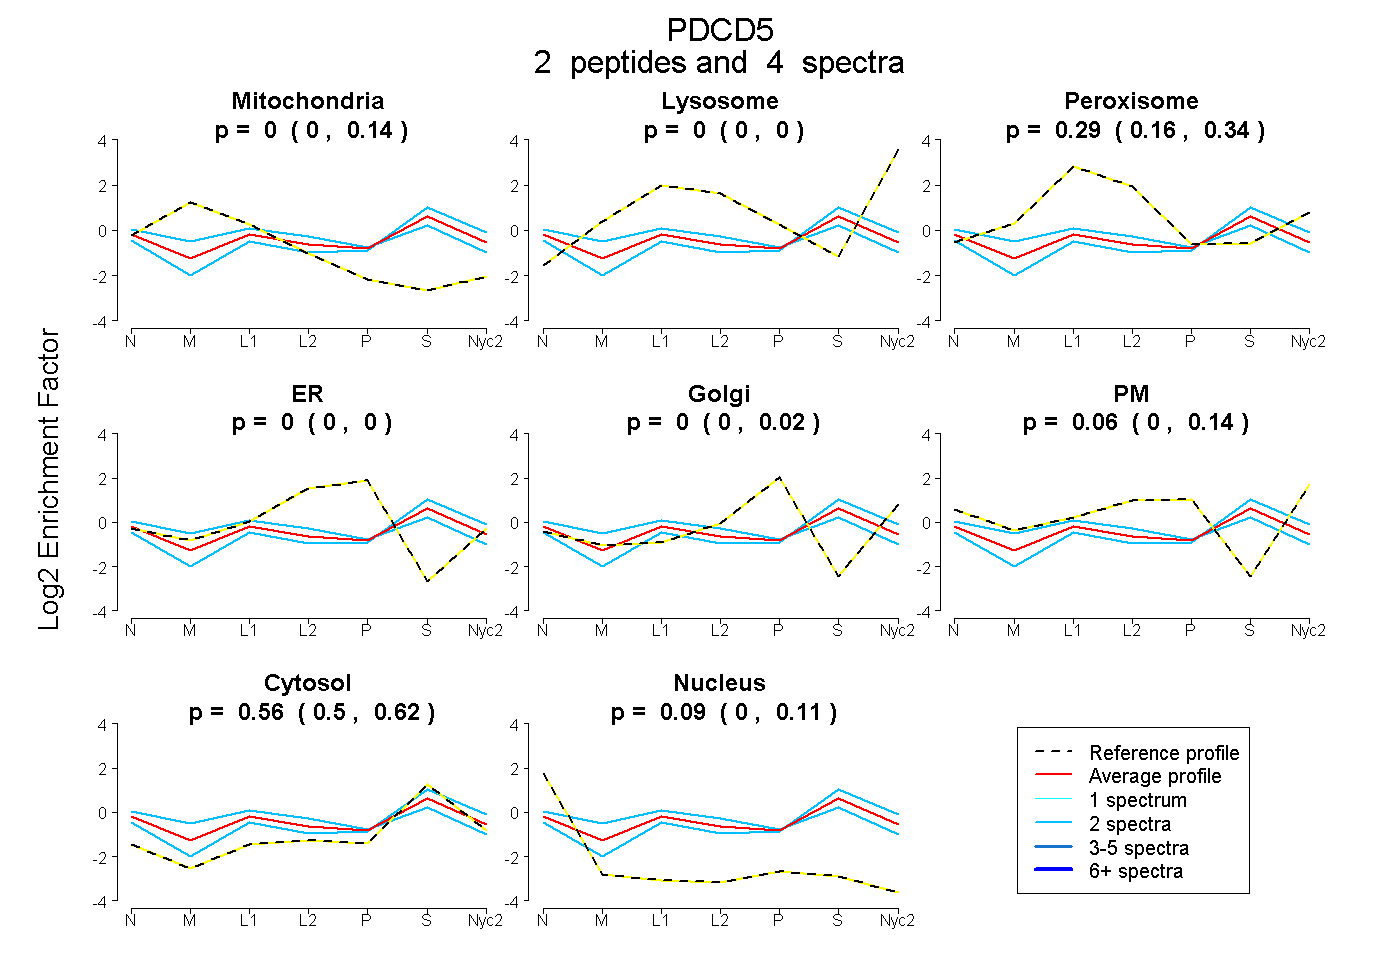
0.000 | 0.138
0.000 | 0.000
0.164 | 0.337
0.000 | 0.002
0.000 | 0.022
0.000 | 0.136
0.505 | 0.624
0.000 | 0.112
1peptide
spectrum
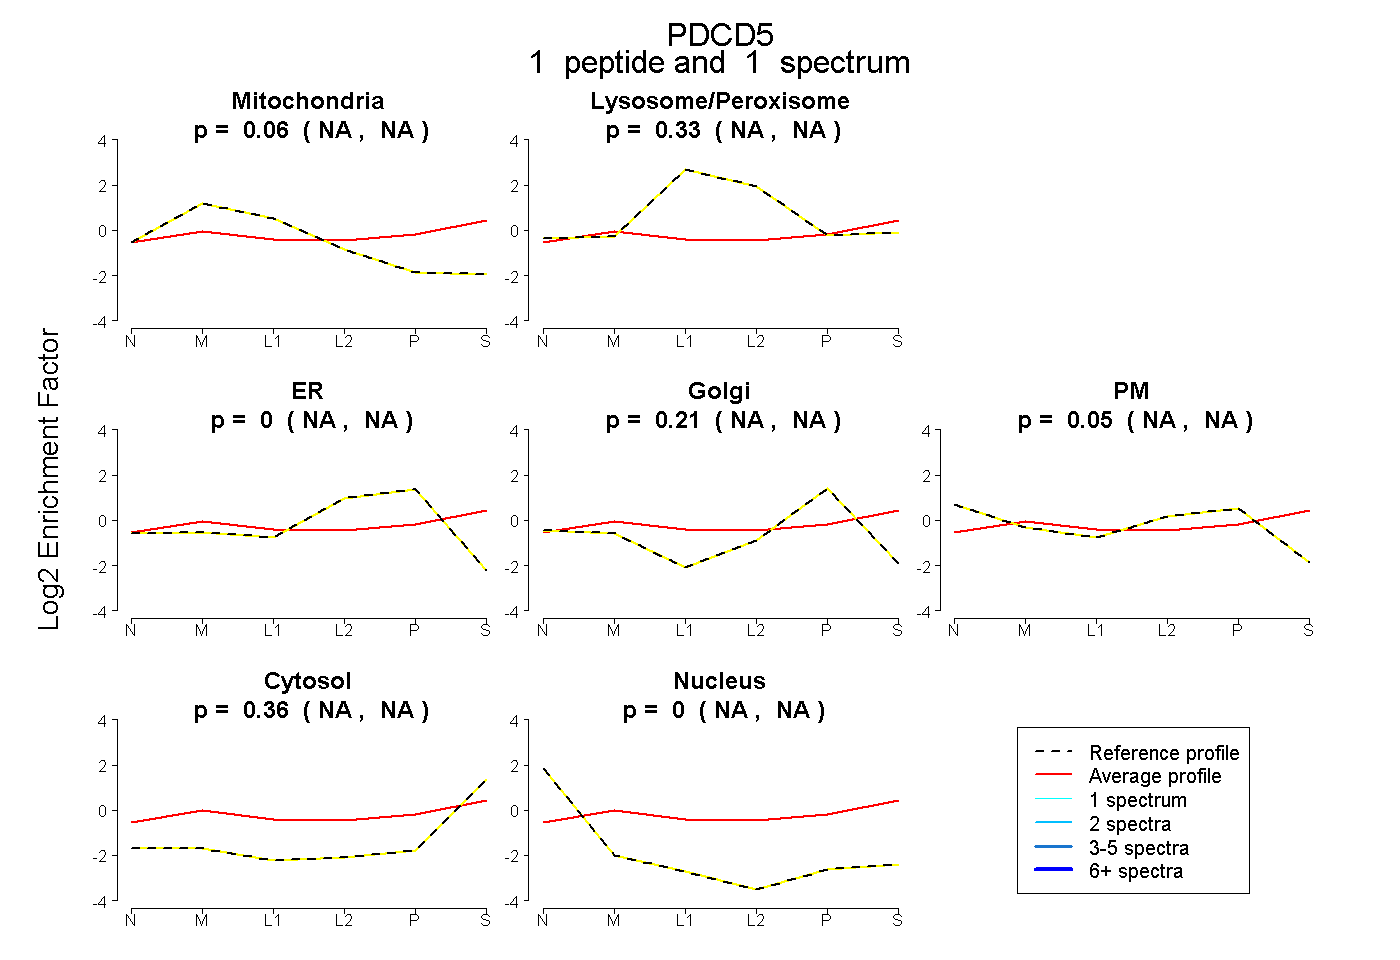
NA | NA
NA | NA
NA | NA
NA | NA
NA | NA
NA | NA
NA | NA
7peptides
spectra
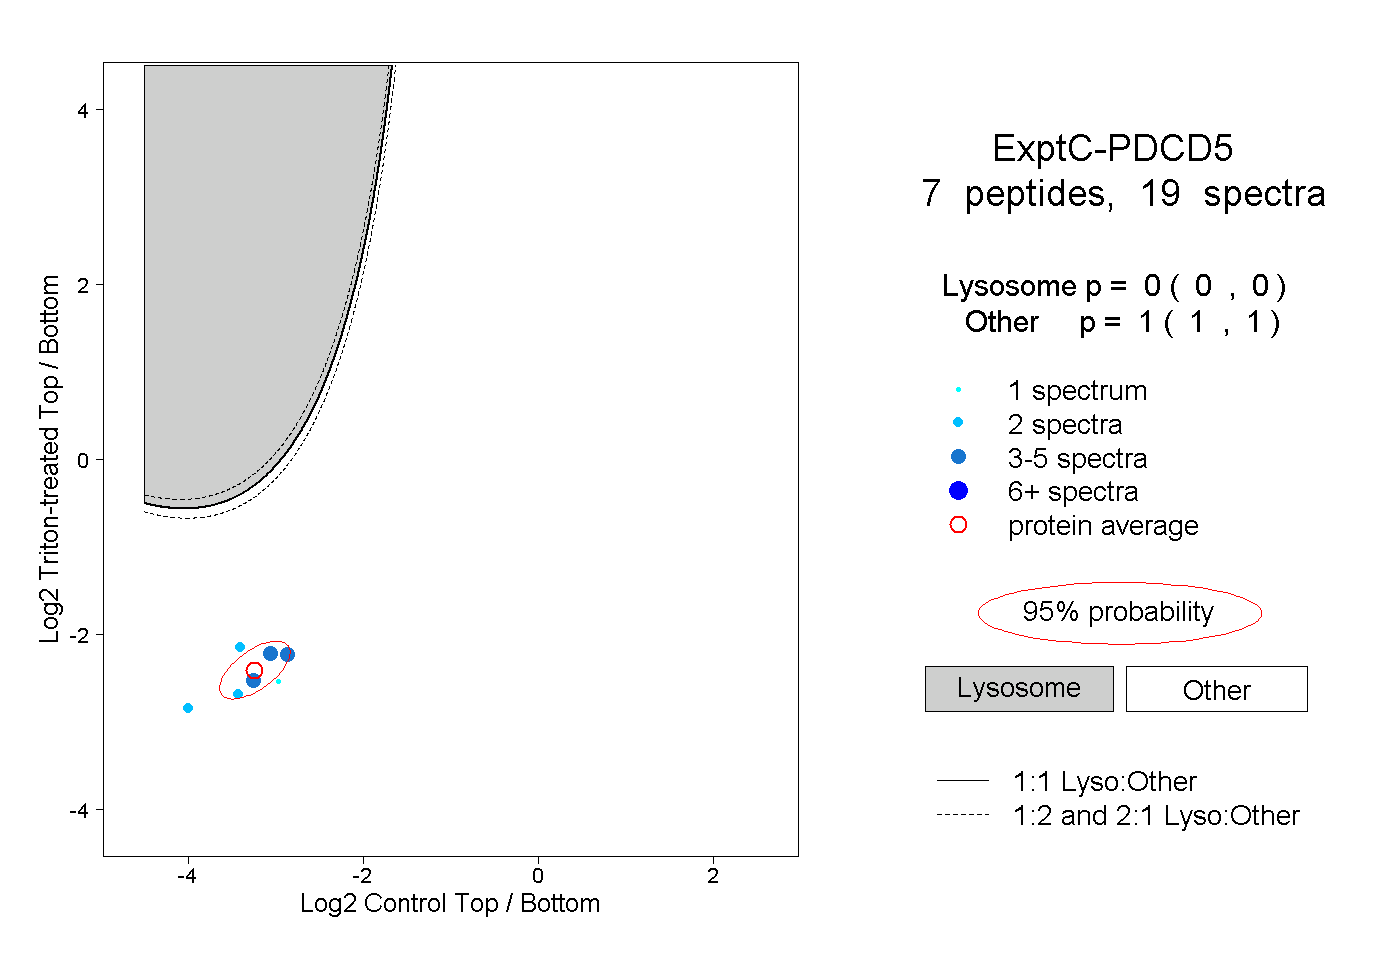
0.000 | 0.000
1.000 | 1.000