 20
20peptides
spectra
0.977 | 0.979
0.000 | 0.000
0.000 | 0.000
0.000 | 0.000
0.000 | 0.000
0.000 | 0.000
0.005 | 0.009
0.014 | 0.017
| Plot | Mito | Lyso | Perox | ER | Golgi | PM | Cytosol | Nucleus | |||||
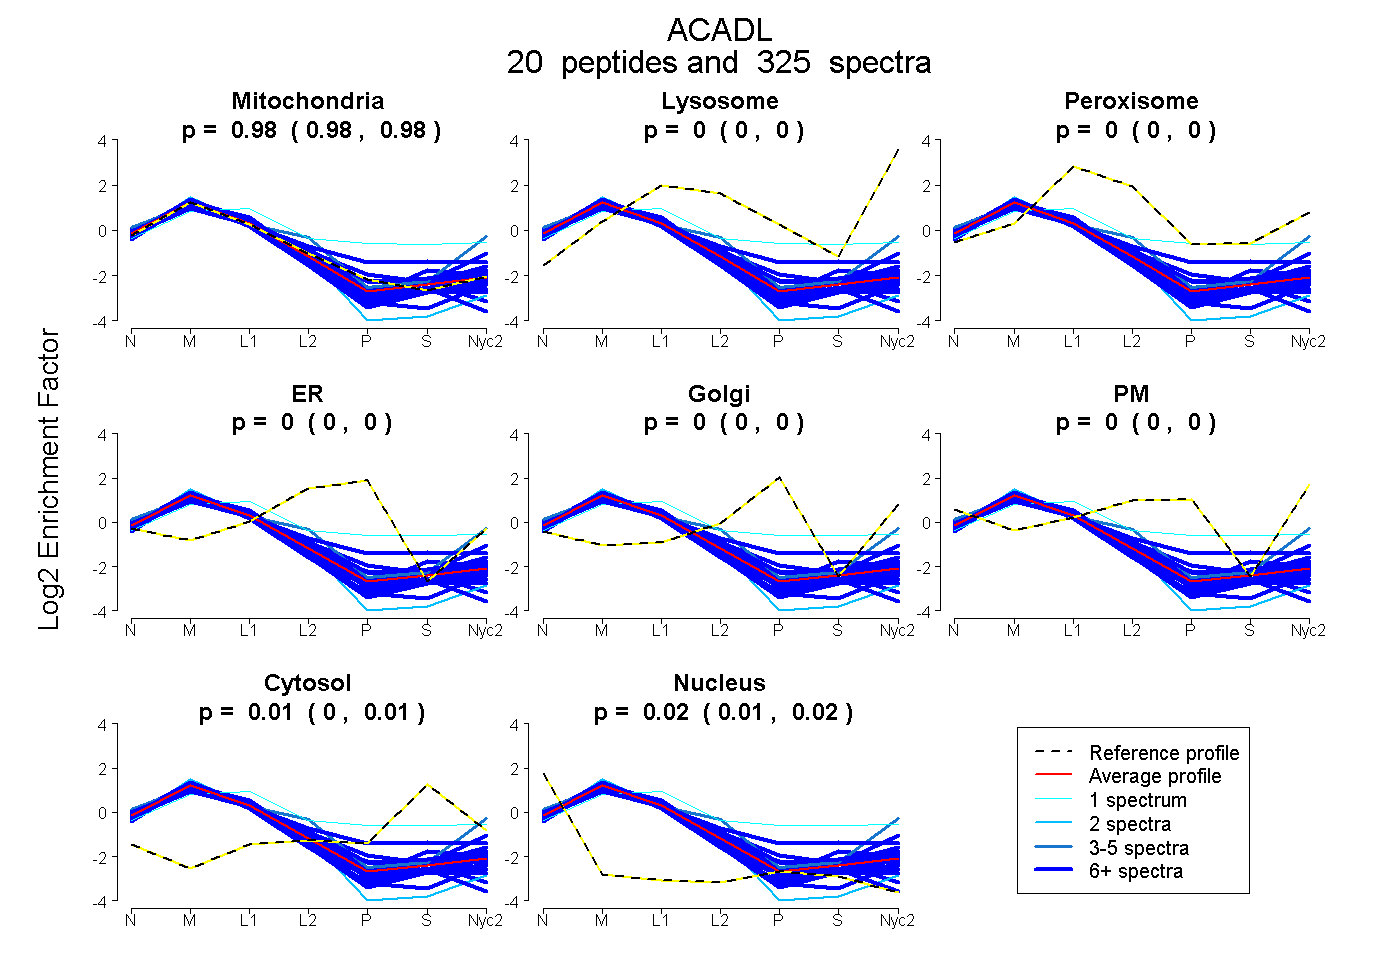
| Expt A |
20 peptides |
325 spectra |
|
0.978 0.977 | 0.979 |
0.000 0.000 | 0.000 |
0.000 0.000 | 0.000 |
0.000 0.000 | 0.000 |
0.000 0.000 | 0.000 |
0.000 0.000 | 0.000 |
0.007 0.005 | 0.009 |
0.015 0.014 | 0.017 |
| 1 spectrum, SPAHGISLFLVENGMK | 0.383 | 0.009 | 0.373 | 0.000 | 0.081 | 0.000 | 0.154 | 0.000 | ||
| 12 spectra, SGSDWILNGSK | 0.864 | 0.000 | 0.081 | 0.000 | 0.000 | 0.000 | 0.037 | 0.018 | ||
| 18 spectra, VQPIYGGTNEIMK | 0.678 | 0.000 | 0.148 | 0.000 | 0.036 | 0.000 | 0.138 | 0.000 | ||
| 33 spectra, AYVDAR | 0.902 | 0.080 | 0.000 | 0.000 | 0.000 | 0.000 | 0.010 | 0.009 | ||
| 2 spectra, CIGAIAMTEPGAGSDLQGVR | 0.952 | 0.000 | 0.000 | 0.000 | 0.000 | 0.000 | 0.000 | 0.048 | ||
| 14 spectra, AGEVSR | 0.862 | 0.000 | 0.044 | 0.000 | 0.000 | 0.060 | 0.015 | 0.018 | ||
| 9 spectra, LPASALLGEENK | 0.959 | 0.000 | 0.000 | 0.000 | 0.000 | 0.000 | 0.023 | 0.019 | ||
| 3 spectra, QIVSDS | 0.717 | 0.234 | 0.000 | 0.000 | 0.000 | 0.000 | 0.000 | 0.049 | ||
| 9 spectra, FFQEEVIPYHEEWEK | 0.977 | 0.000 | 0.000 | 0.000 | 0.000 | 0.000 | 0.023 | 0.000 | ||
| 18 spectra, EQIEQFIPQMTAGK | 0.950 | 0.000 | 0.000 | 0.000 | 0.000 | 0.000 | 0.035 | 0.016 | ||
| 74 spectra, TNICVTR | 0.894 | 0.000 | 0.000 | 0.000 | 0.000 | 0.000 | 0.000 | 0.106 | ||
| 15 spectra, GFYYLMQELPQER | 0.965 | 0.000 | 0.000 | 0.000 | 0.000 | 0.000 | 0.000 | 0.035 | ||
| 29 spectra, AQDTAELFFEDVR | 0.941 | 0.000 | 0.000 | 0.000 | 0.000 | 0.000 | 0.000 | 0.059 | ||
| 21 spectra, IFSSEHDIFR | 0.949 | 0.000 | 0.034 | 0.000 | 0.000 | 0.000 | 0.017 | 0.000 | ||
| 9 spectra, LETPSAK | 0.921 | 0.000 | 0.000 | 0.000 | 0.000 | 0.000 | 0.079 | 0.000 | ||
| 9 spectra, LDSASASMAK | 0.995 | 0.000 | 0.000 | 0.000 | 0.000 | 0.000 | 0.005 | 0.000 | ||
| 26 spectra, TVAHIQTVQHK | 0.973 | 0.000 | 0.000 | 0.000 | 0.000 | 0.000 | 0.000 | 0.027 | ||
| 11 spectra, AFVDSCLQLHETK | 0.938 | 0.000 | 0.000 | 0.000 | 0.000 | 0.000 | 0.000 | 0.062 | ||
| 6 spectra, LTDIGIR | 0.952 | 0.000 | 0.000 | 0.000 | 0.000 | 0.000 | 0.000 | 0.048 | ||
| 6 spectra, QGLLGINIAEK | 0.940 | 0.000 | 0.000 | 0.000 | 0.000 | 0.000 | 0.000 | 0.060 |
| Plot | Mito | Lyso or Perox | ER | Golgi | PM | Cytosol | Nucleus | ||||||
| Expt B |
17 peptides |
131 spectra |
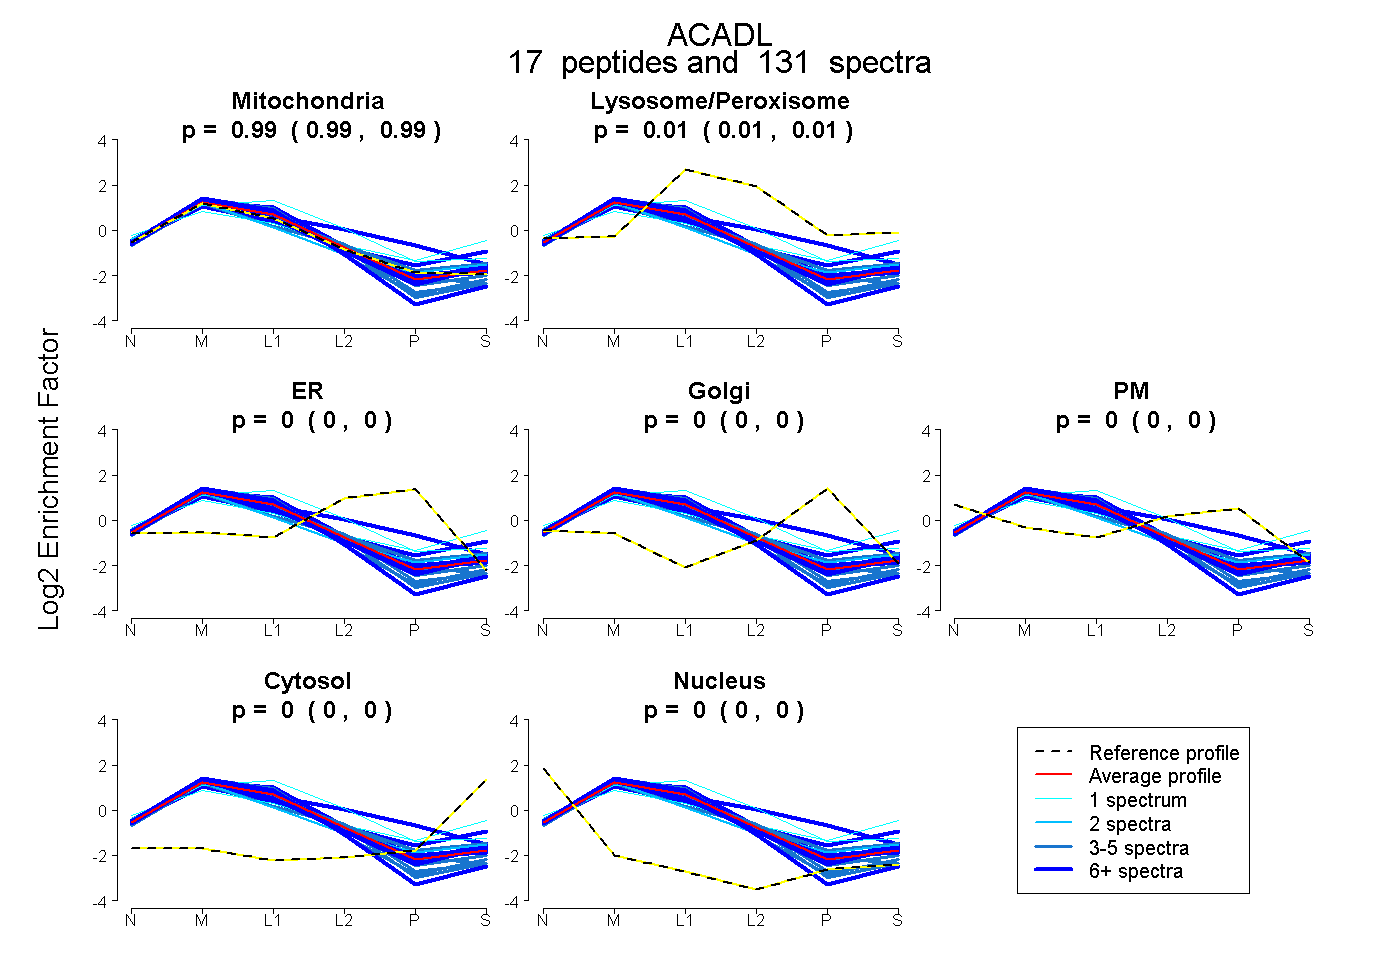 |
0.989 0.986 | 0.992 |
0.011 0.007 | 0.014 |
0.000 0.000 | 0.000 |
0.000 0.000 | 0.000 |
0.000 0.000 | 0.000 |
0.000 0.000 | 0.000 |
0.000 0.000 | 0.000 |
|||
| Plot | Lyso | Other | |||||||||||
| Expt C |
20 peptides |
668 spectra |
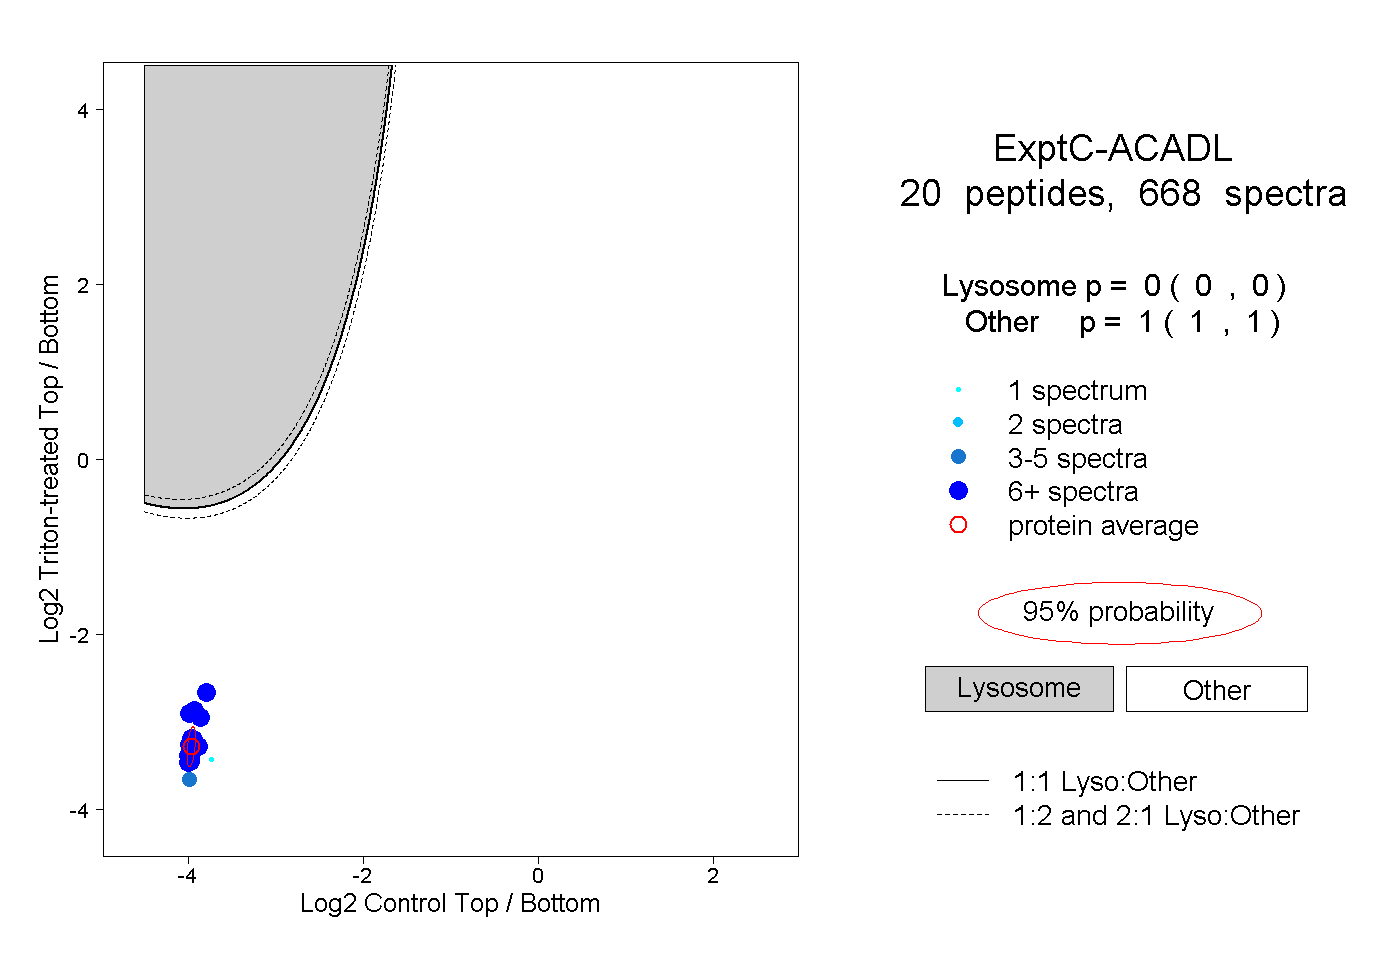 |
0.000 0.000 | 0.000 |
1.000 1.000 | 1.000 |
||||||||
| Plot | Lyso | Other | |||||||||||
| Expt D |
13 peptides |
58 spectra |
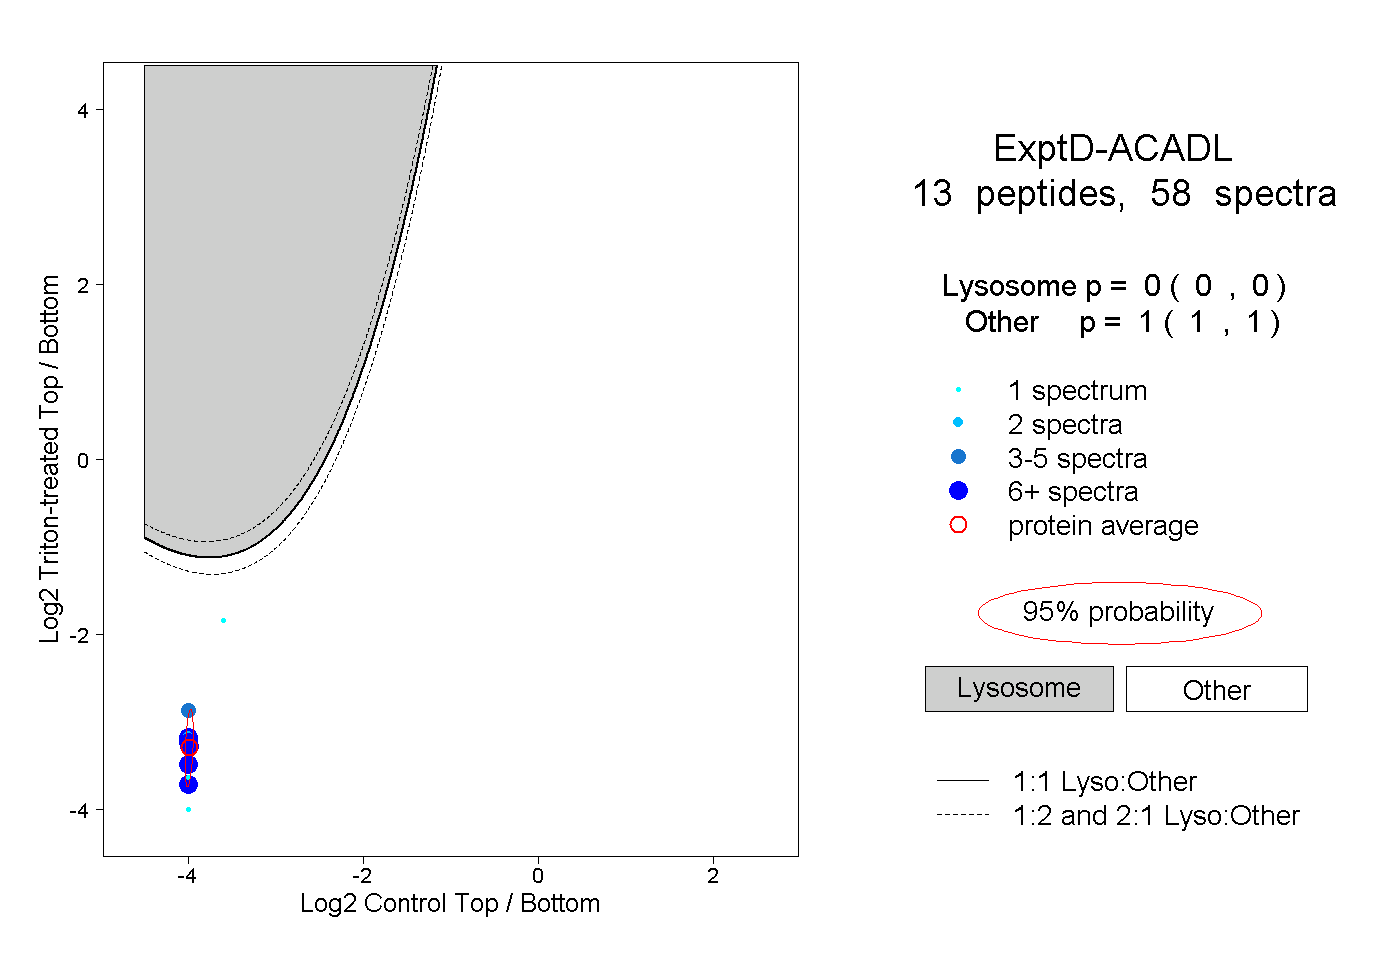 |
0.000 0.000 | 0.000 |
1.000 1.000 | 1.000 |