 2
2peptides
spectra
0.000 | 0.194
0.000 | 0.290
0.000 | 0.258
0.000 | 0.000
0.000 | 0.269
0.000 | 0.090
0.531 | 0.801
0.000 | 0.091
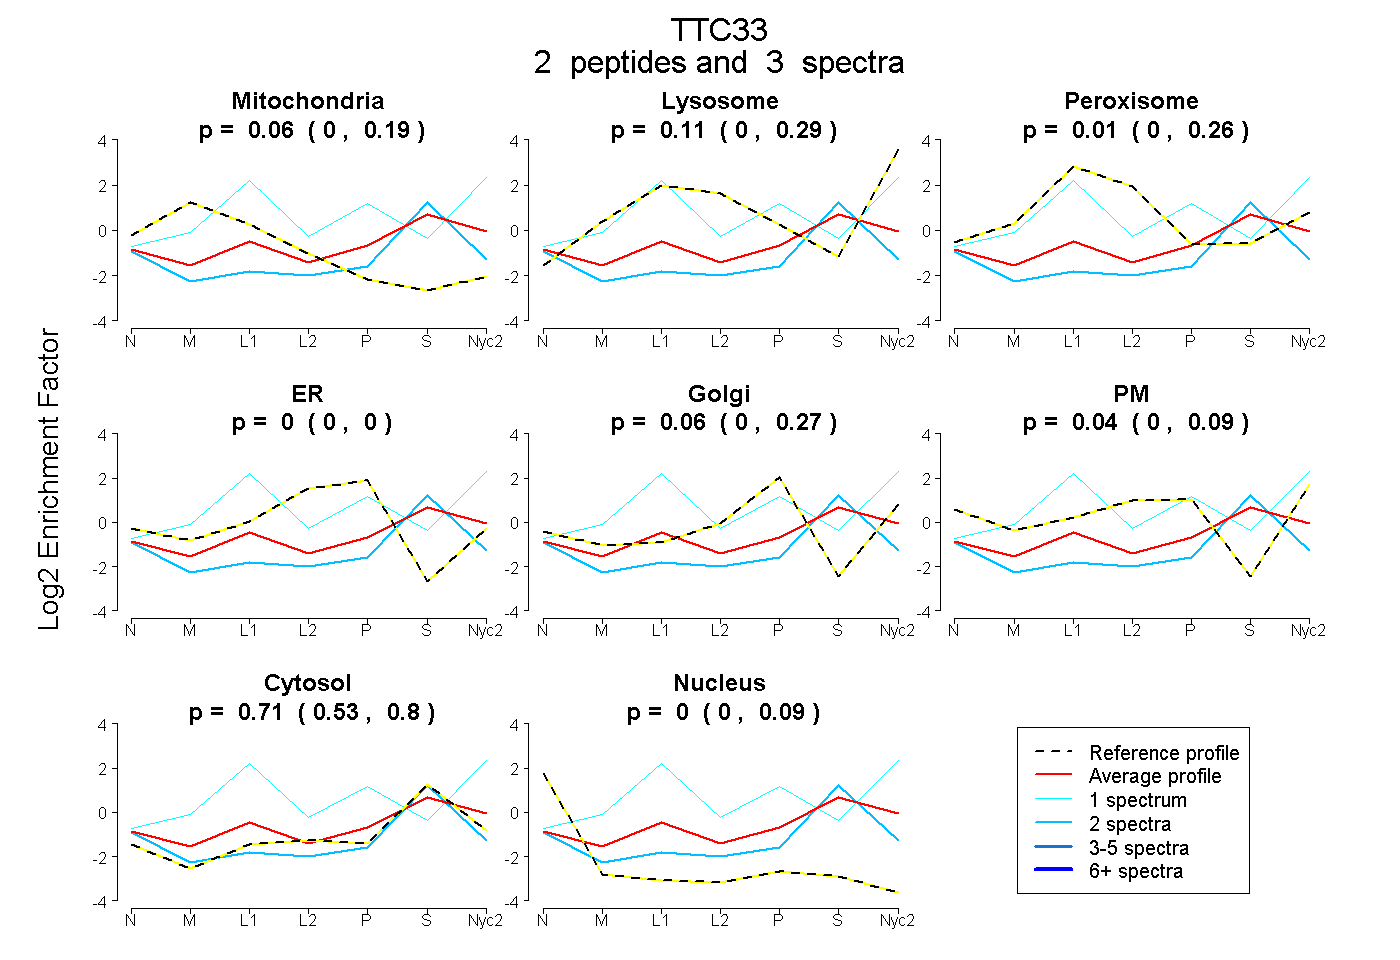
| Plot | Mito | Lyso | Perox | ER | Golgi | PM | Cytosol | Nucleus | |||||
| Expt A |
2 peptides |
3 spectra |
|
0.064 0.000 | 0.194 |
0.110 0.000 | 0.290 |
0.014 0.000 | 0.258 |
0.000 0.000 | 0.000 |
0.057 0.000 | 0.269 |
0.042 0.000 | 0.090 |
0.713 0.531 | 0.801 |
0.000 0.000 | 0.091 |