 2
2peptides
spectra
0.000 | 0.128
0.000 | 0.000
0.000 | 0.163
0.000 | 0.249
0.000 | 0.145
0.000 | 0.110
0.597 | 0.792
0.000 | 0.038
| Plot | Mito | Lyso | Perox | ER | Golgi | PM | Cytosol | Nucleus | |||||
| Expt A |
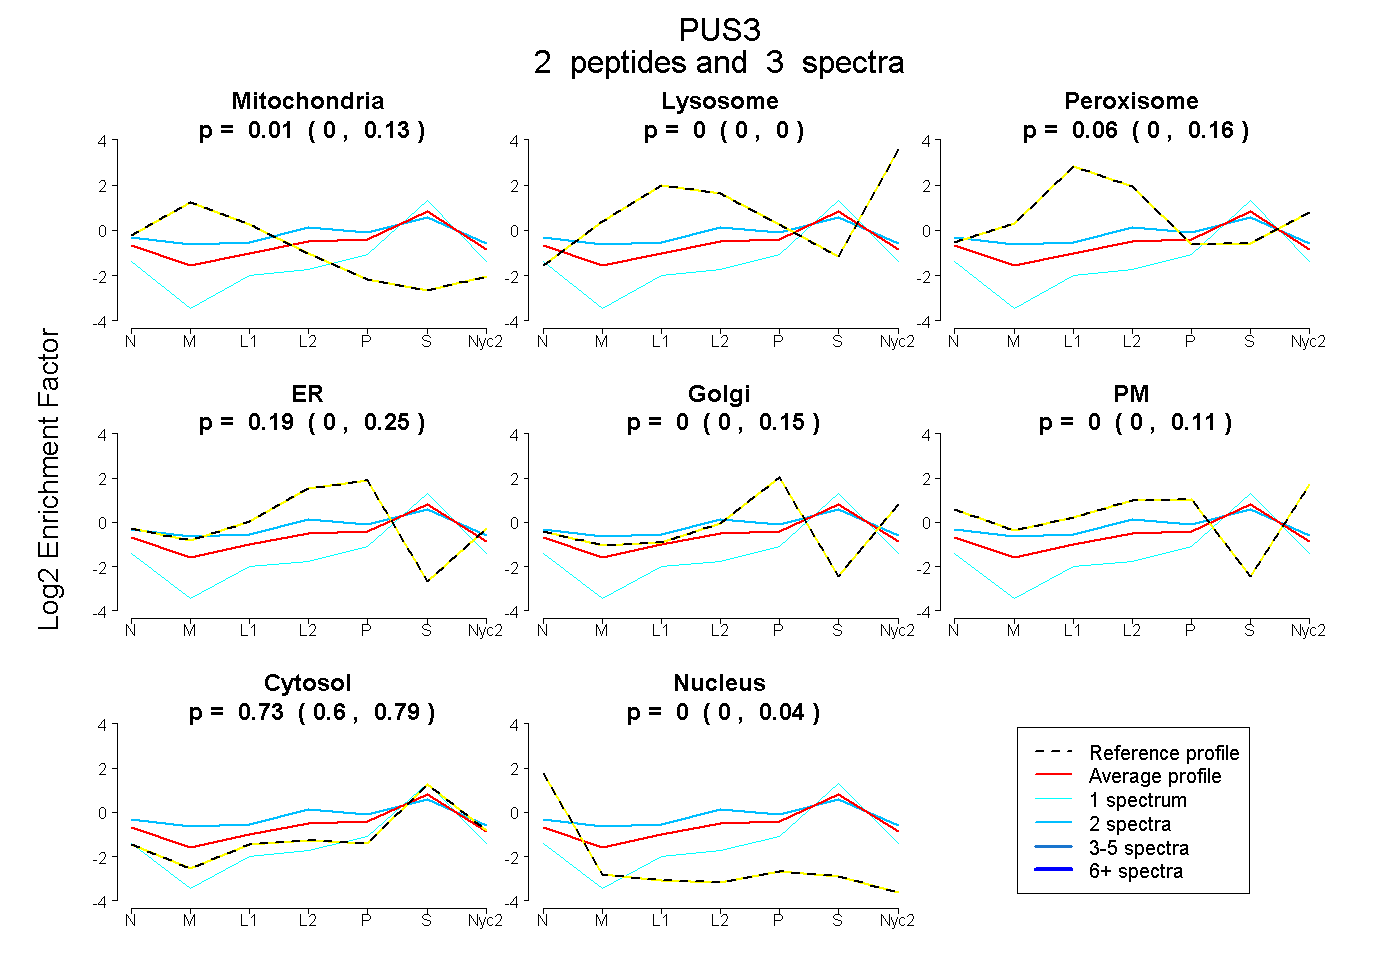
2 peptides |
3 spectra |
|
0.014 0.000 | 0.128 |
0.000 0.000 | 0.000 |
0.061 0.000 | 0.163 |
0.194 0.000 | 0.249 |
0.000 0.000 | 0.145 |
0.000 0.000 | 0.110 |
0.731 0.597 | 0.792 |
0.000 0.000 | 0.038 |
| 2 spectra, YAHILNR | 0.042 | 0.000 | 0.195 | 0.193 | 0.000 | 0.046 | 0.524 | 0.000 | ||
| 1 spectrum, IQHFVR | 0.000 | 0.000 | 0.000 | 0.000 | 0.000 | 0.000 | 0.930 | 0.070 |