 18
18peptides
spectra
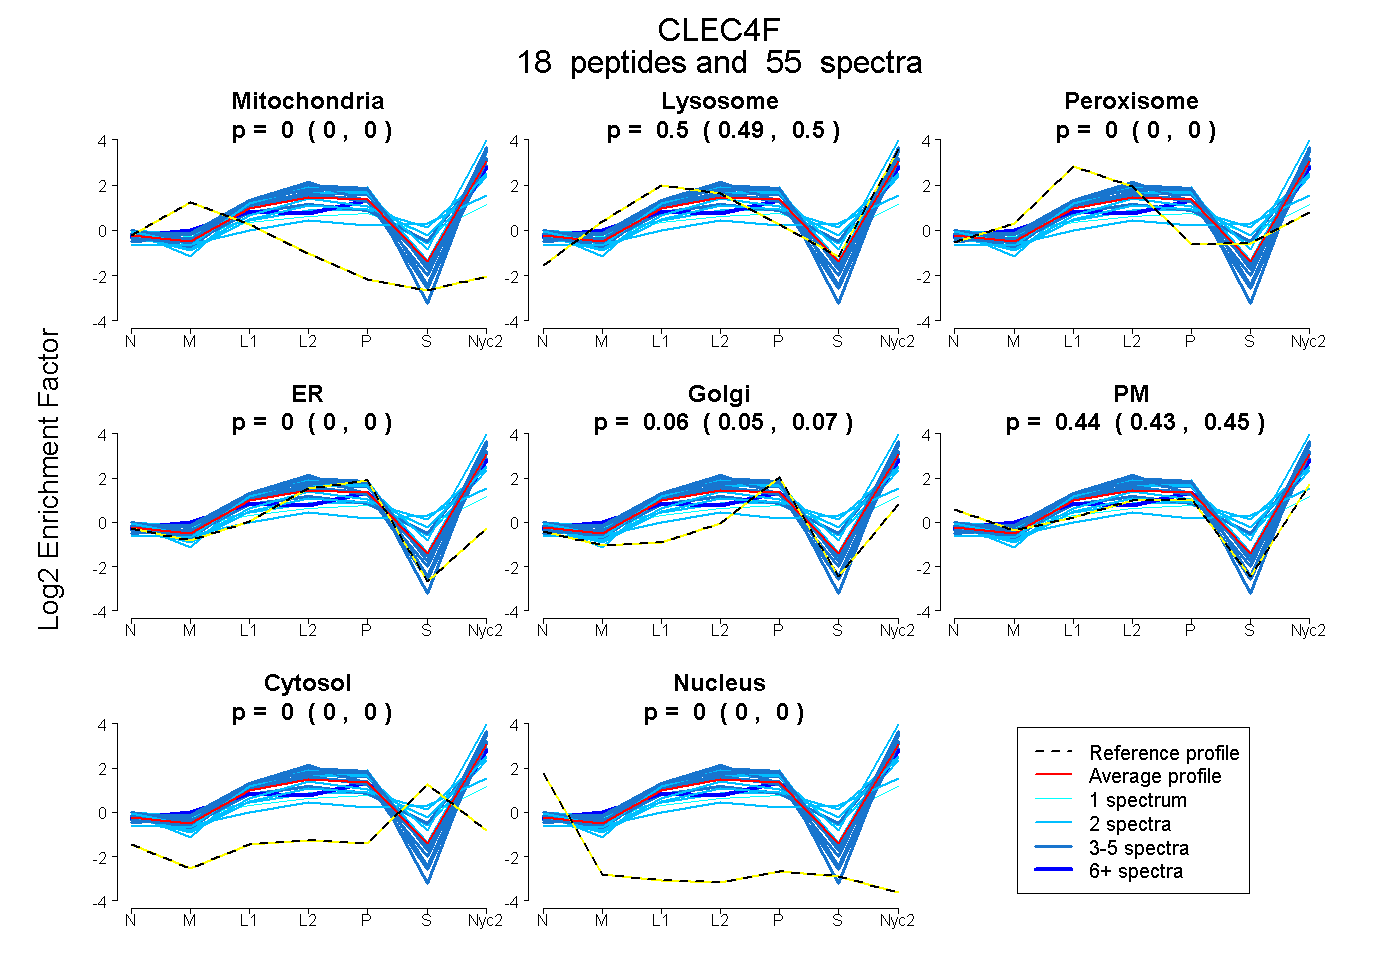
0.000 | 0.000
0.489 | 0.504
0.000 | 0.000
0.000 | 0.000
0.052 | 0.072
0.426 | 0.452
0.000 | 0.000
0.000 | 0.000
9peptides
spectra
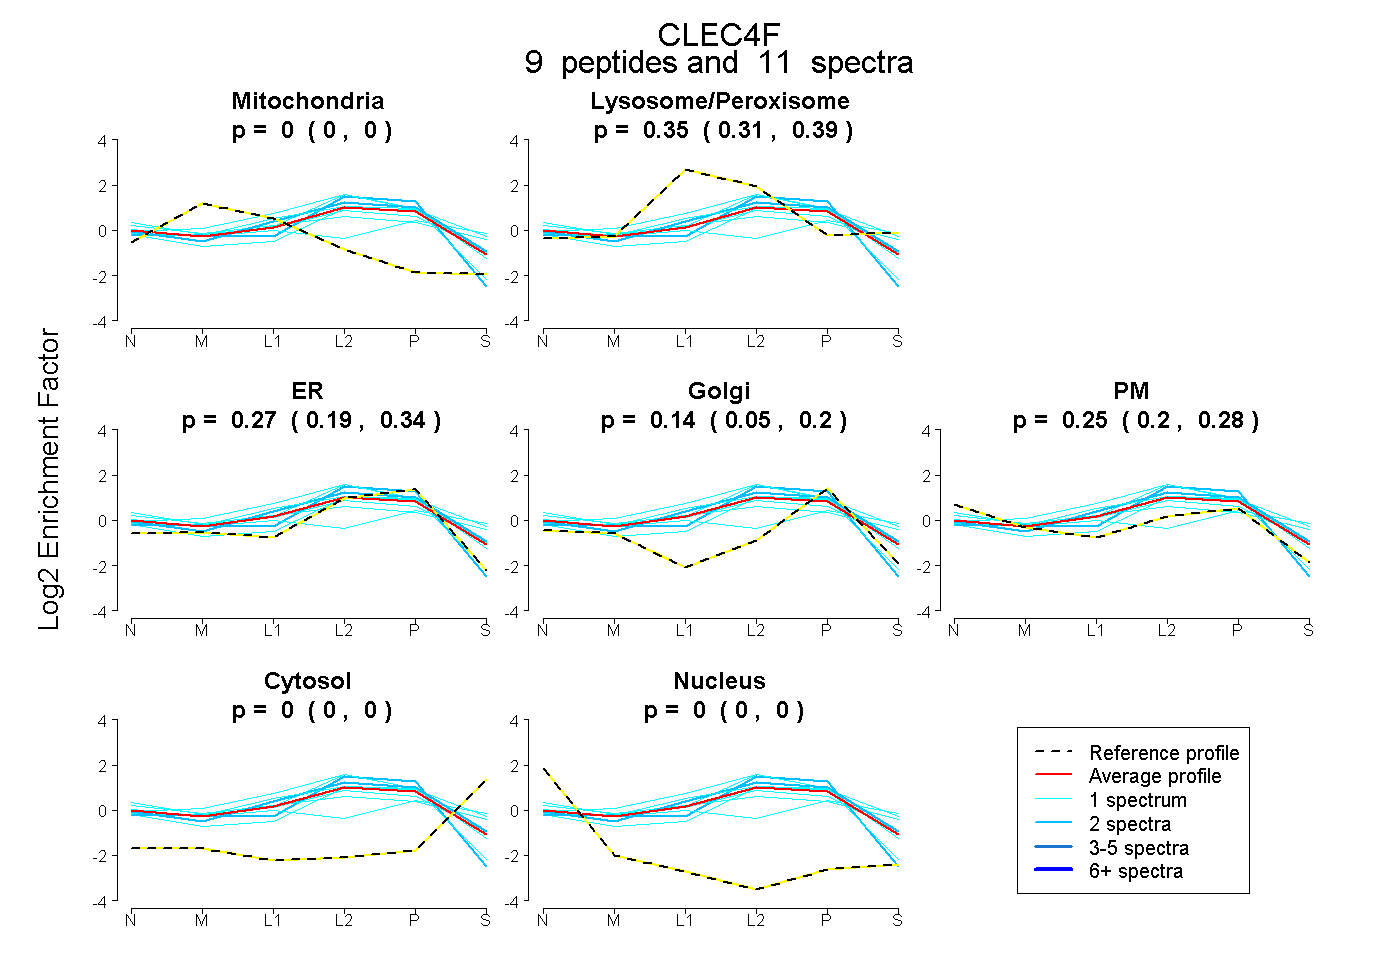
0.000 | 0.000
0.311 | 0.385
0.185 | 0.341
0.051 | 0.201
0.201 | 0.284
0.000 | 0.000
0.000 | 0.000
21peptides
spectra
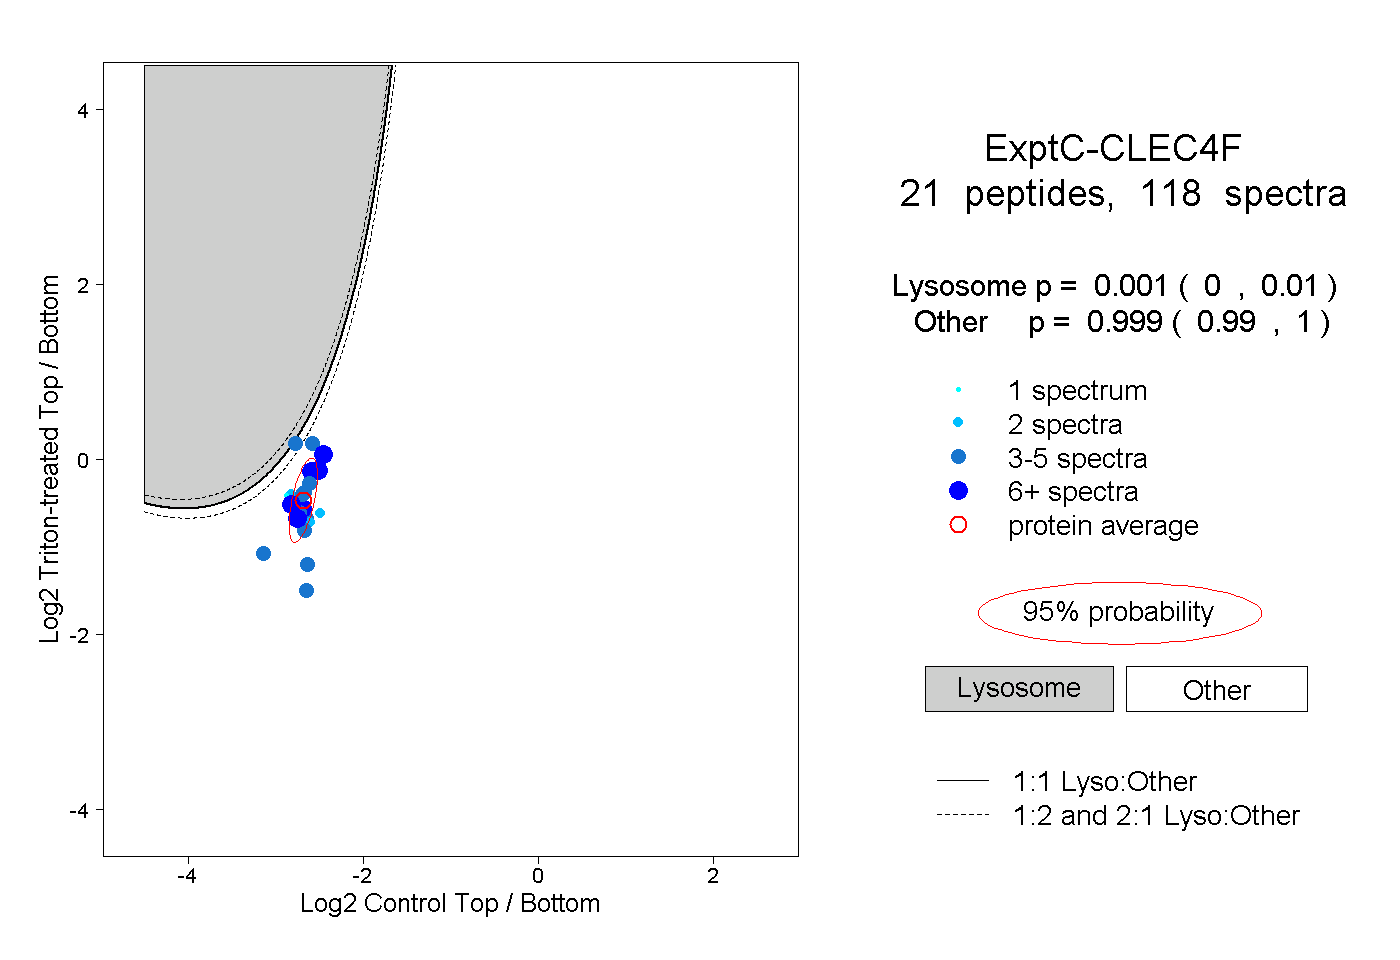
0.000 | 0.010
0.990 | 1.000
7peptides
spectra
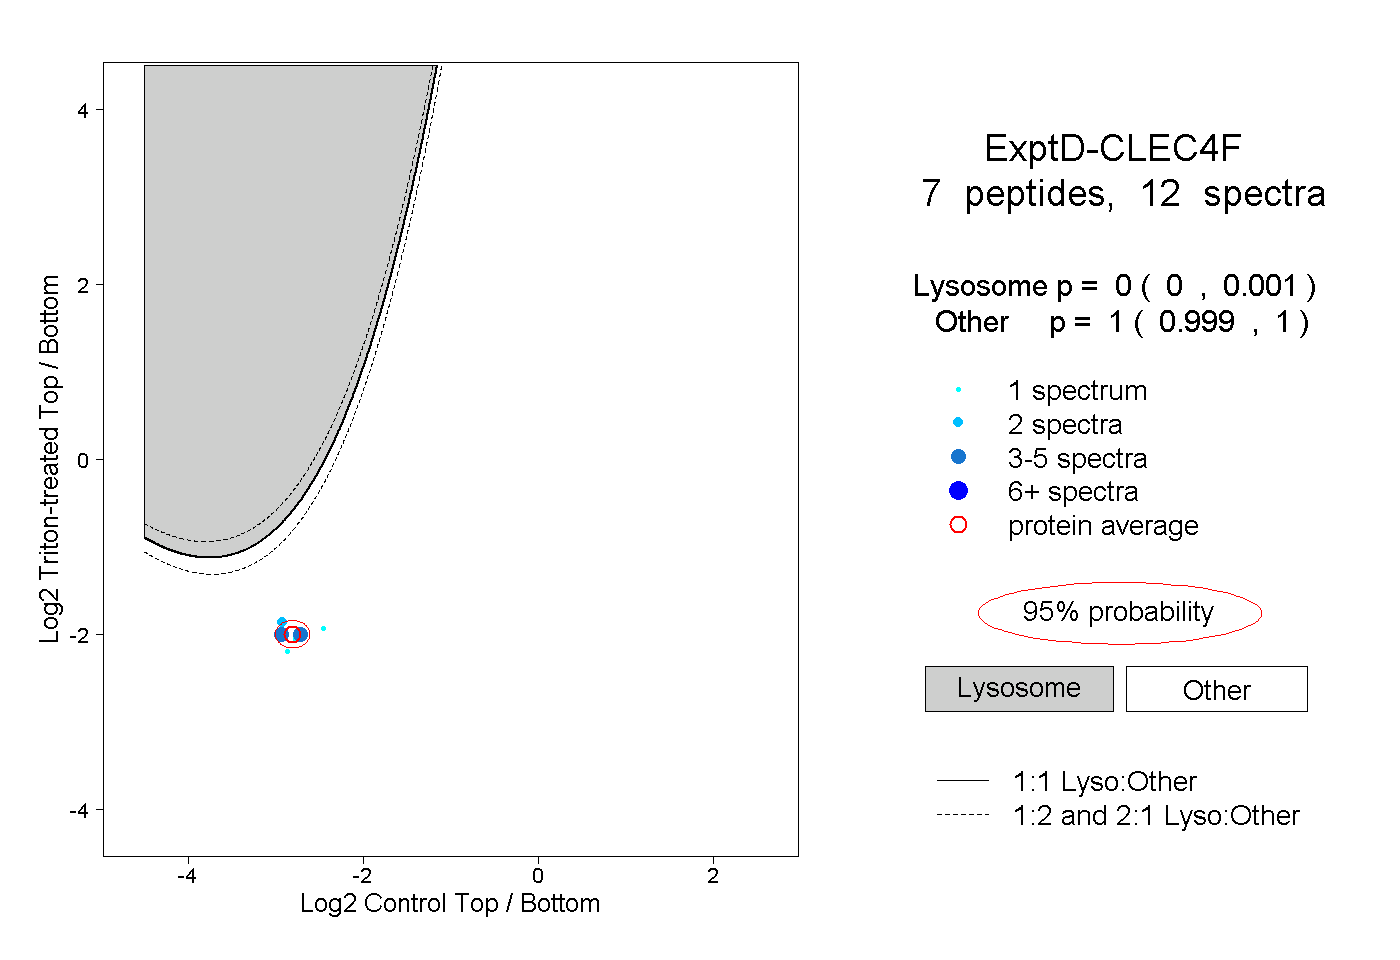
0.000 | 0.001
0.999 | 1.000