 5
5peptides
spectra
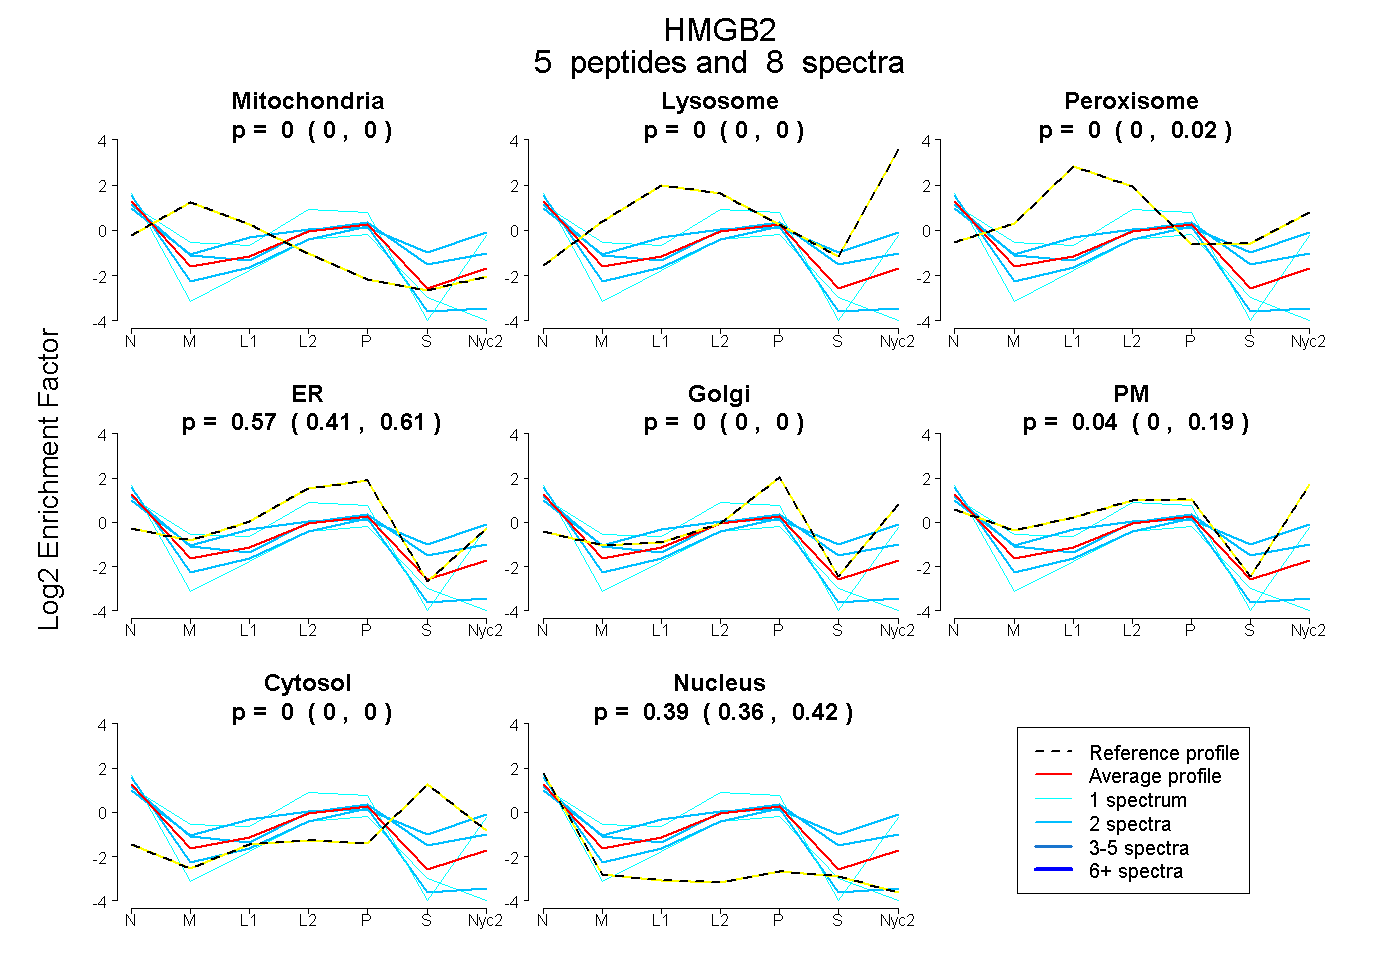
0.000 | 0.000
0.000 | 0.000
0.000 | 0.025
0.411 | 0.606
0.000 | 0.000
0.000 | 0.187
0.000 | 0.000
0.362 | 0.418
2peptides
spectra
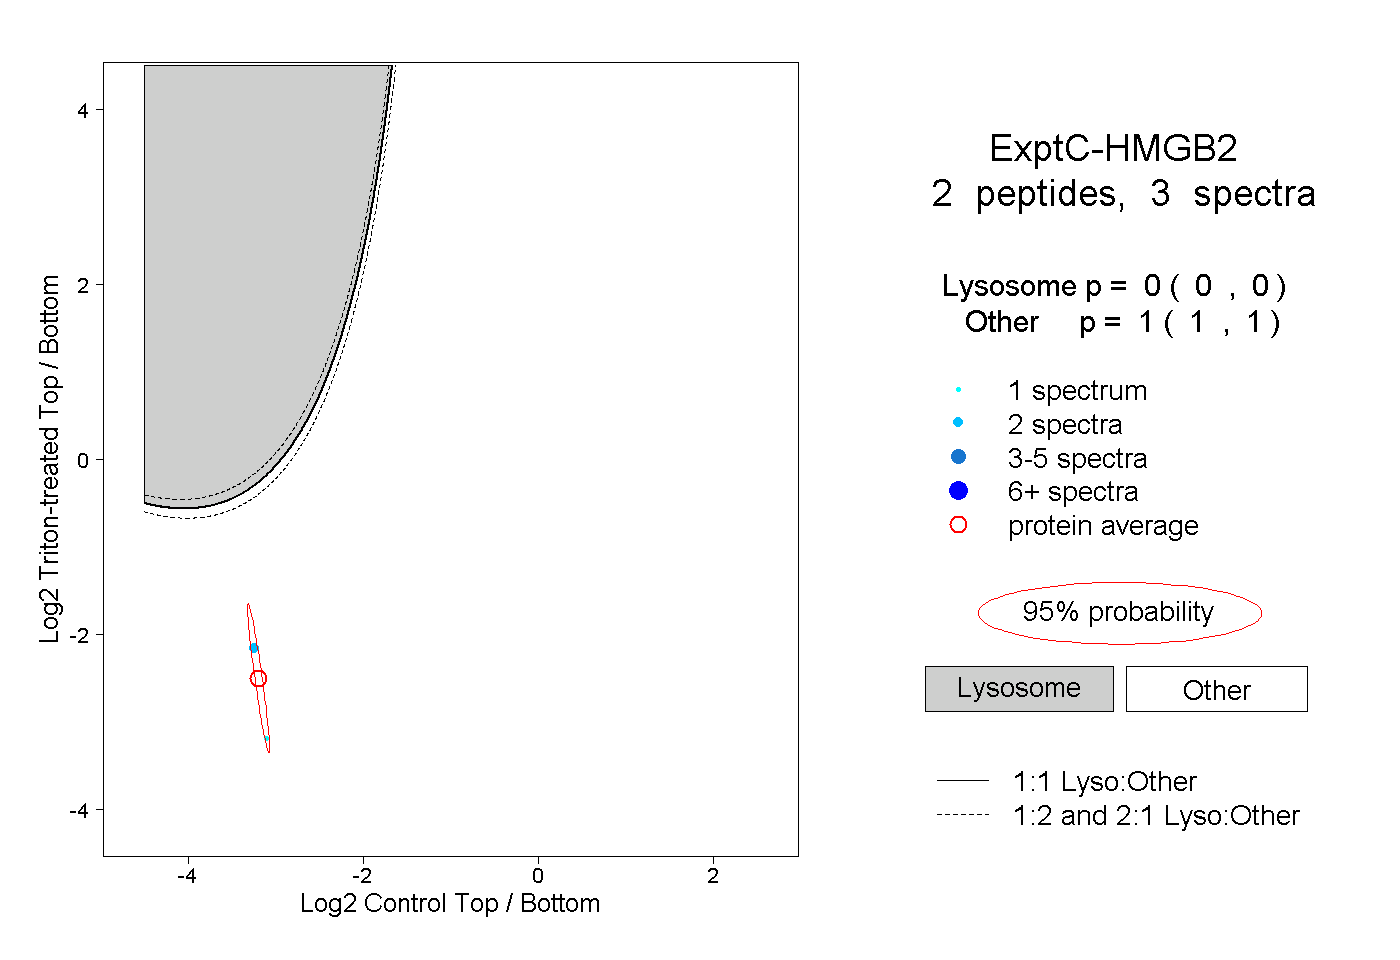
0.000 | 0.000
1.000 | 1.000
| Plot | Mito | Lyso | Perox | ER | Golgi | PM | Cytosol | Nucleus | |||||
| Expt A |
5 peptides |
8 spectra |
|
0.000 0.000 | 0.000 |
0.000 0.000 | 0.000 |
0.000 0.000 | 0.025 |
0.572 0.411 | 0.606 |
0.000 0.000 | 0.000 |
0.036 0.000 | 0.187 |
0.000 0.000 | 0.000 |
0.392 0.362 | 0.418 |
||
| Plot | Lyso | Other | |||||||||||
| Expt C |
2 peptides |
3 spectra |
|
0.000 0.000 | 0.000 |
1.000 1.000 | 1.000 |