 2
2peptides
spectra
NA | NA
NA | NA
NA | NA
NA | NA
NA | NA
NA | NA
NA | NA
NA | NA
2peptides
spectra
NA | NA
NA | NA
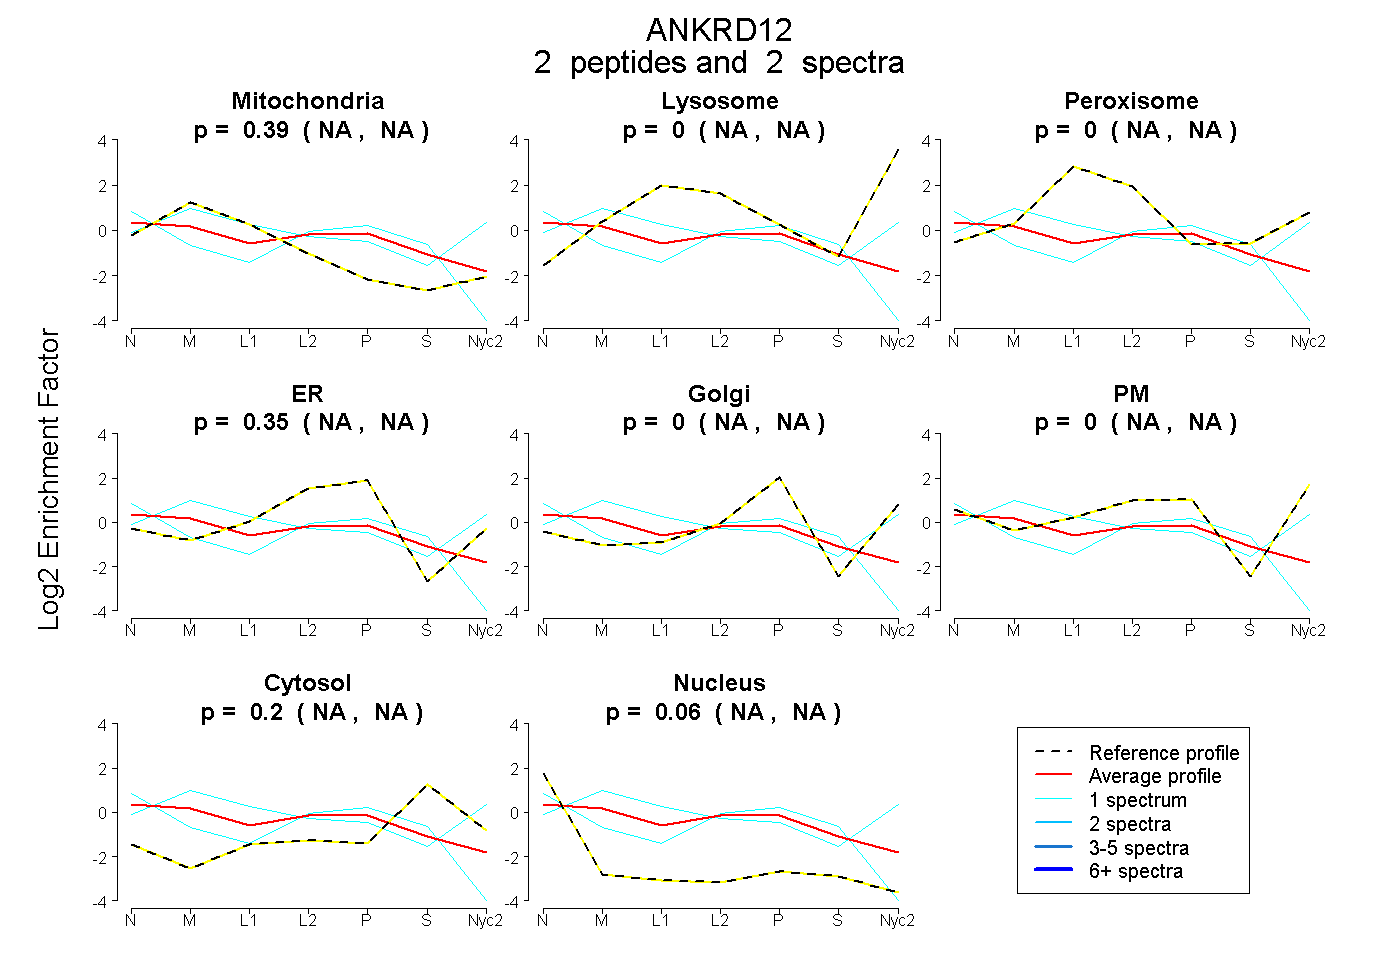
| Plot | Mito | Lyso | Perox | ER | Golgi | PM | Cytosol | Nucleus | |||||
| Expt A |
2 peptides |
2 spectra |
|
0.391 NA | NA |
0.000 NA | NA |
0.000 NA | NA |
0.353 NA | NA |
0.000 NA | NA |
0.000 NA | NA |
0.198 NA | NA |
0.058 NA | NA |
||
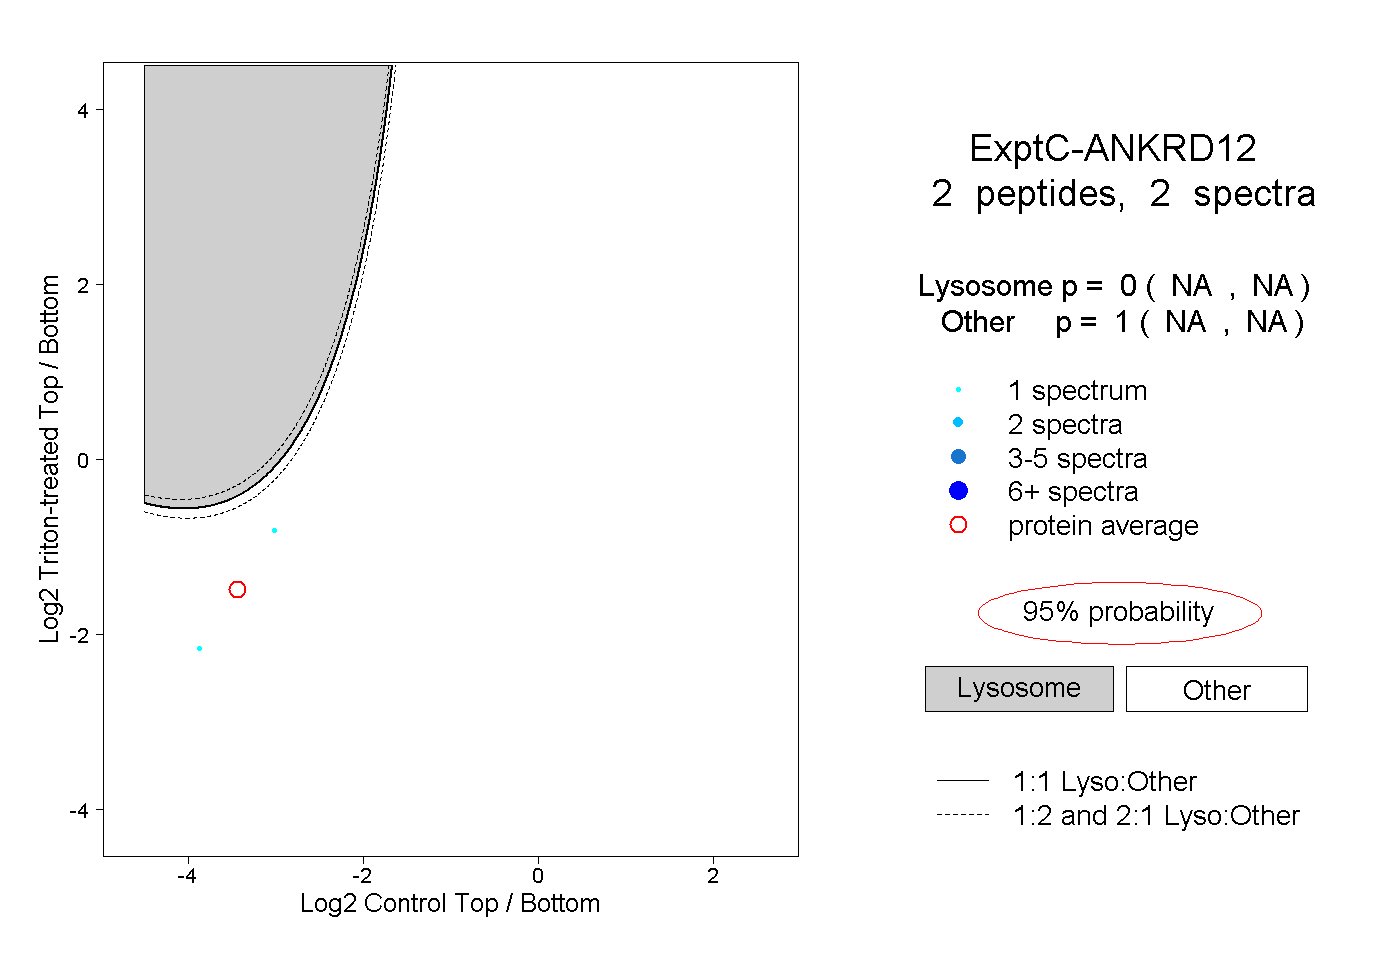
| Plot | Lyso | Other | |||||||||||
| Expt C |
2 peptides |
2 spectra |
|
0.000 NA | NA |
1.000 NA | NA |
| 1 spectrum, SVLSLGK | 0.000 | 1.000 | ||||||||
| 1 spectrum, EATPIK | 0.001 | 0.999 |