 1
1peptide
spectra
0.000 | 0.000
0.000 | 0.061
0.000 | 0.075
0.000 | 0.054
0.000 | 0.077
0.000 | 0.102
0.837 | 0.893
0.000 | 0.000
1peptide
spectra
0.000 | 0.000
1.000 | 1.000
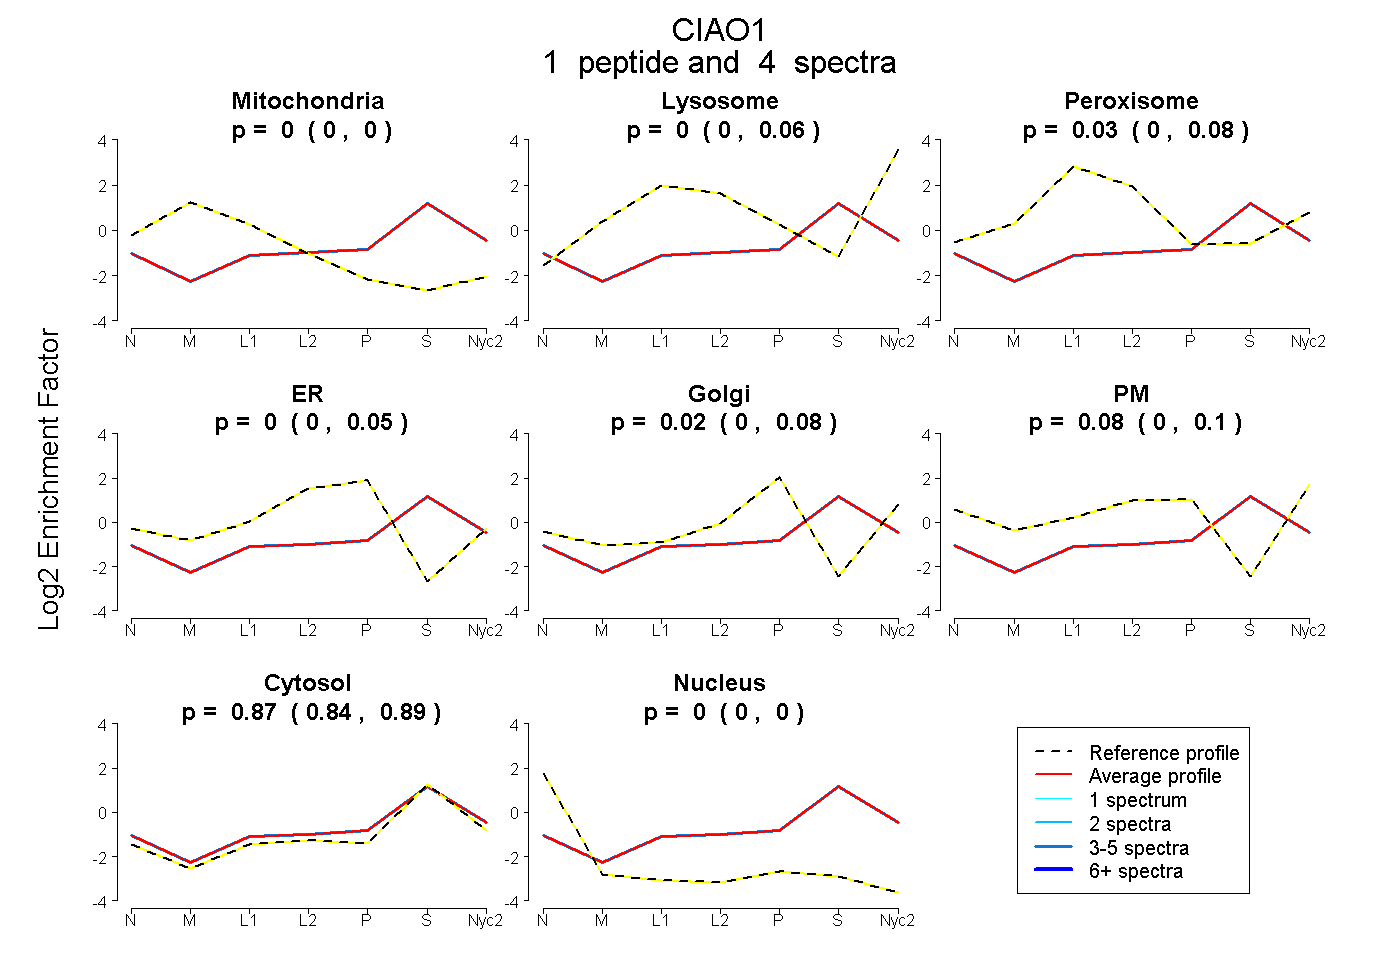
| Plot | Mito | Lyso | Perox | ER | Golgi | PM | Cytosol | Nucleus | |||||
| Expt A |
1 peptide |
4 spectra |
|
0.000 0.000 | 0.000 |
0.004 0.000 | 0.061 |
0.034 0.000 | 0.075 |
0.000 0.000 | 0.054 |
0.018 0.000 | 0.077 |
0.076 0.000 | 0.102 |
0.868 0.837 | 0.893 |
0.000 0.000 | 0.000 |
||
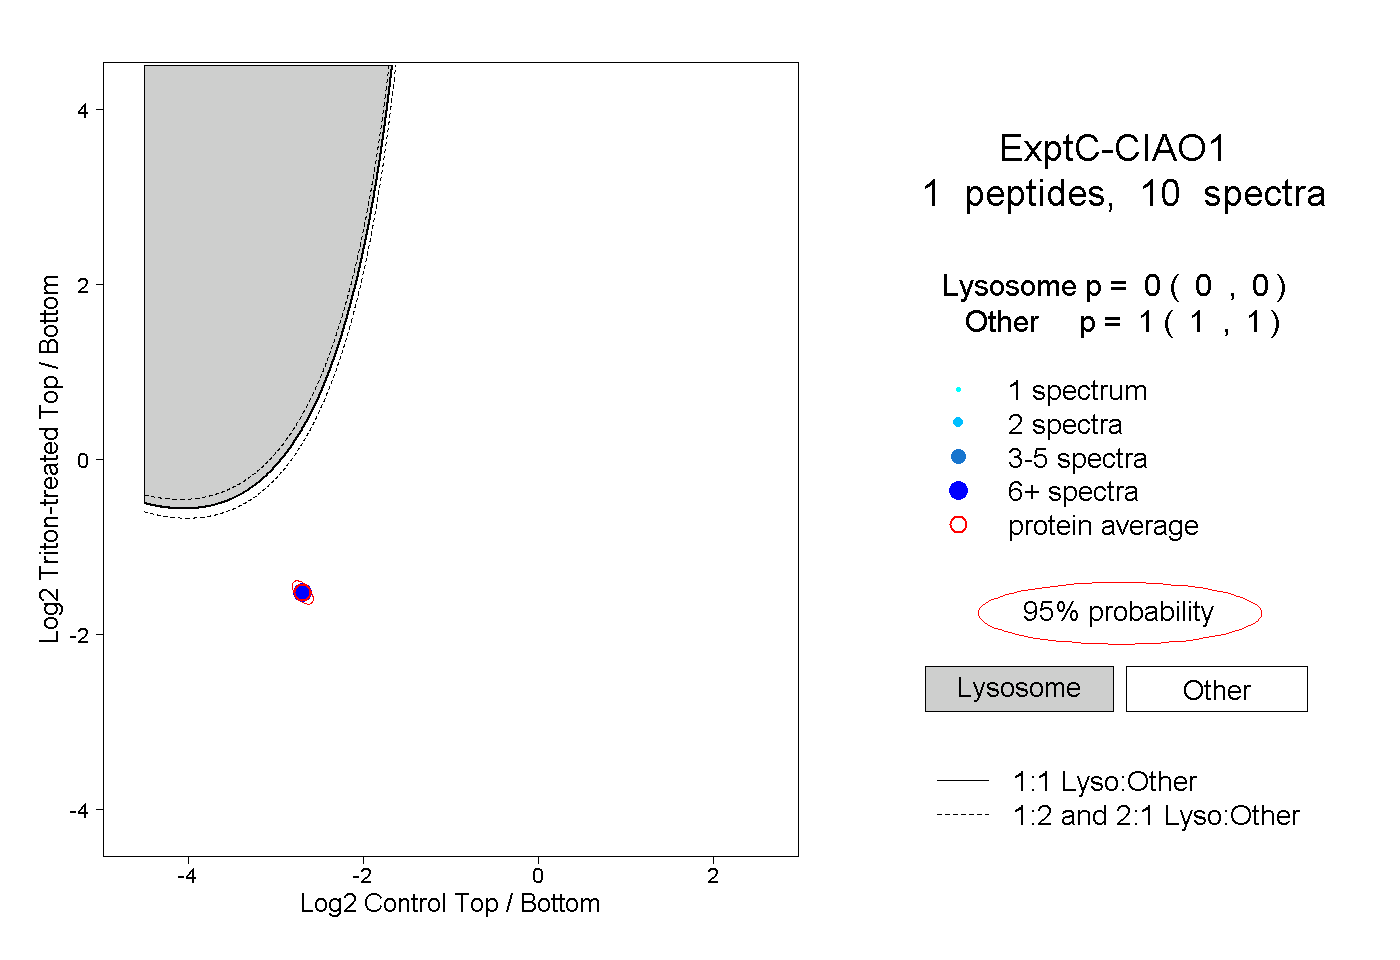
| Plot | Lyso | Other | |||||||||||
| Expt C |
1 peptide |
10 spectra |
|
0.000 0.000 | 0.000 |
1.000 1.000 | 1.000 |