20
20peptides
spectra
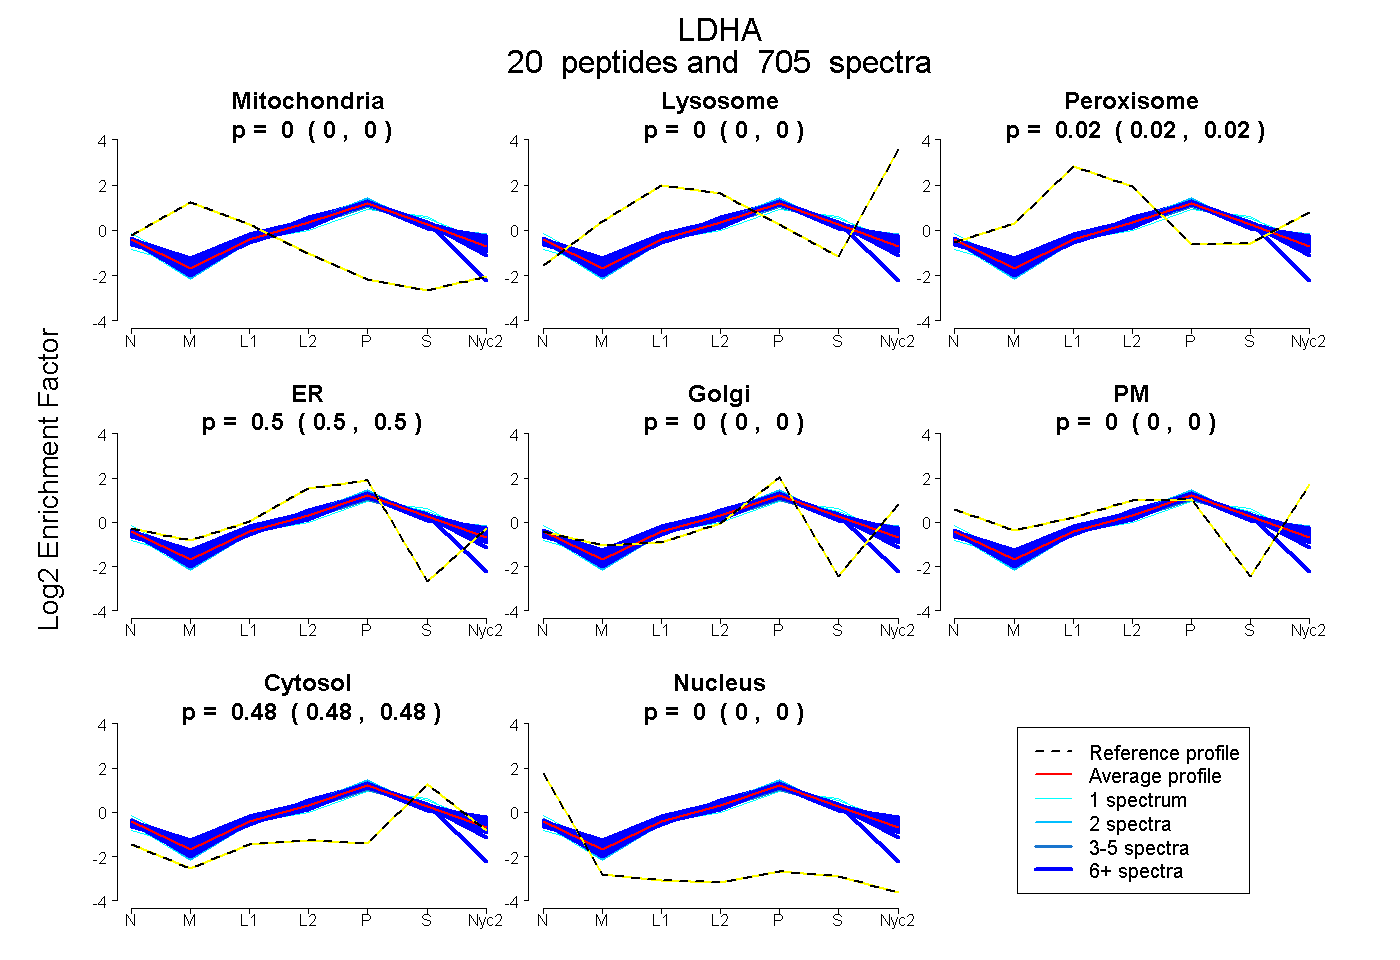
0.000 | 0.000
0.000 | 0.000
0.016 | 0.018
0.504 | 0.505
0.000 | 0.000
0.000 | 0.000
0.478 | 0.479
0.000 | 0.000
19peptides
spectra
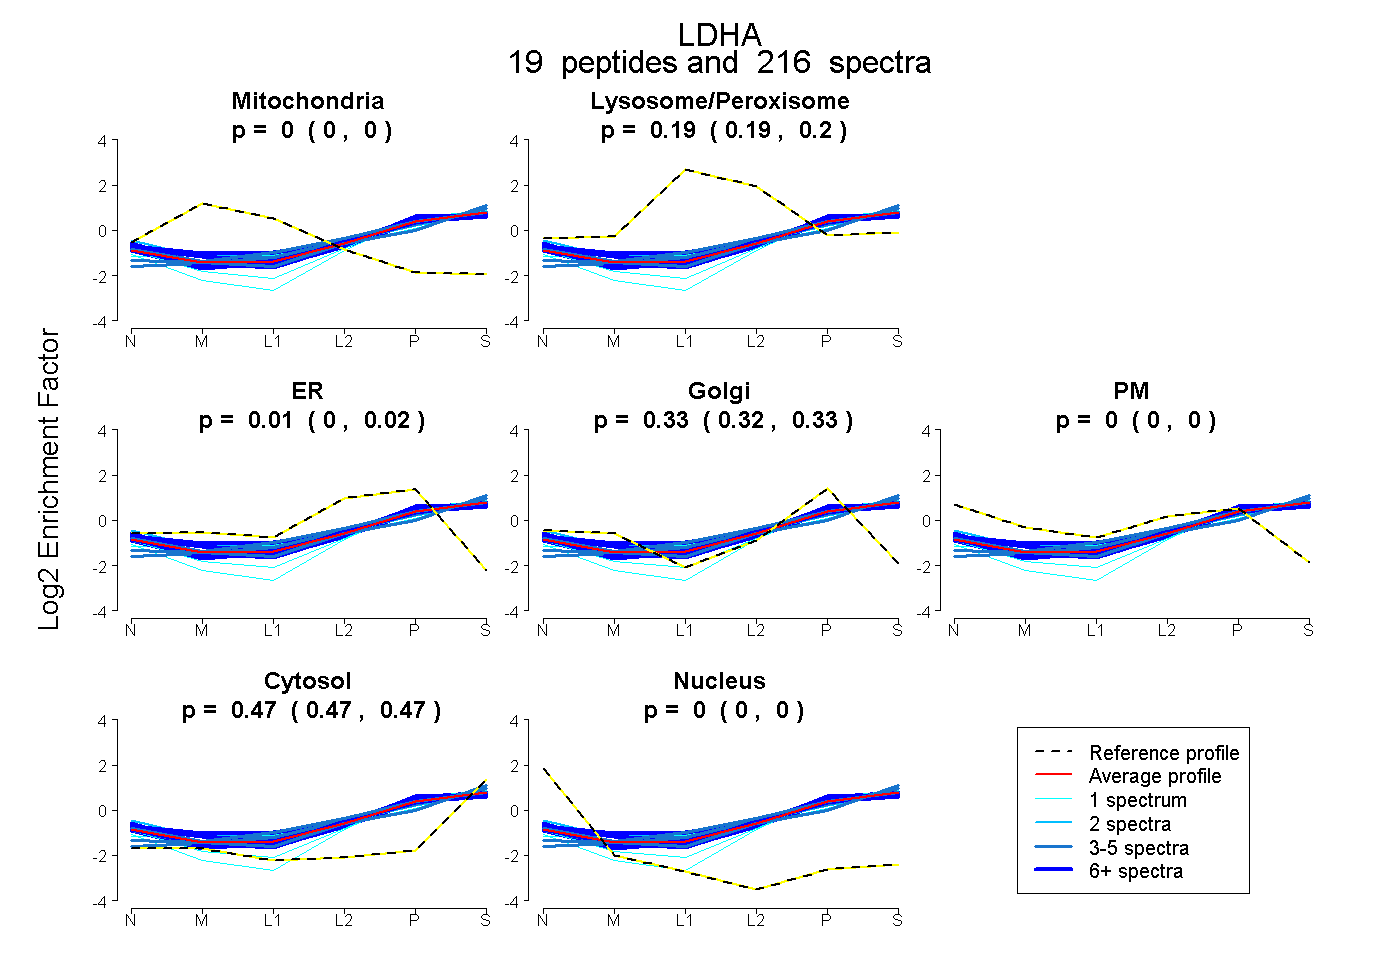
0.000 | 0.000
0.191 | 0.197
0.003 | 0.015
0.320 | 0.330
0.000 | 0.000
0.469 | 0.473
0.000 | 0.000
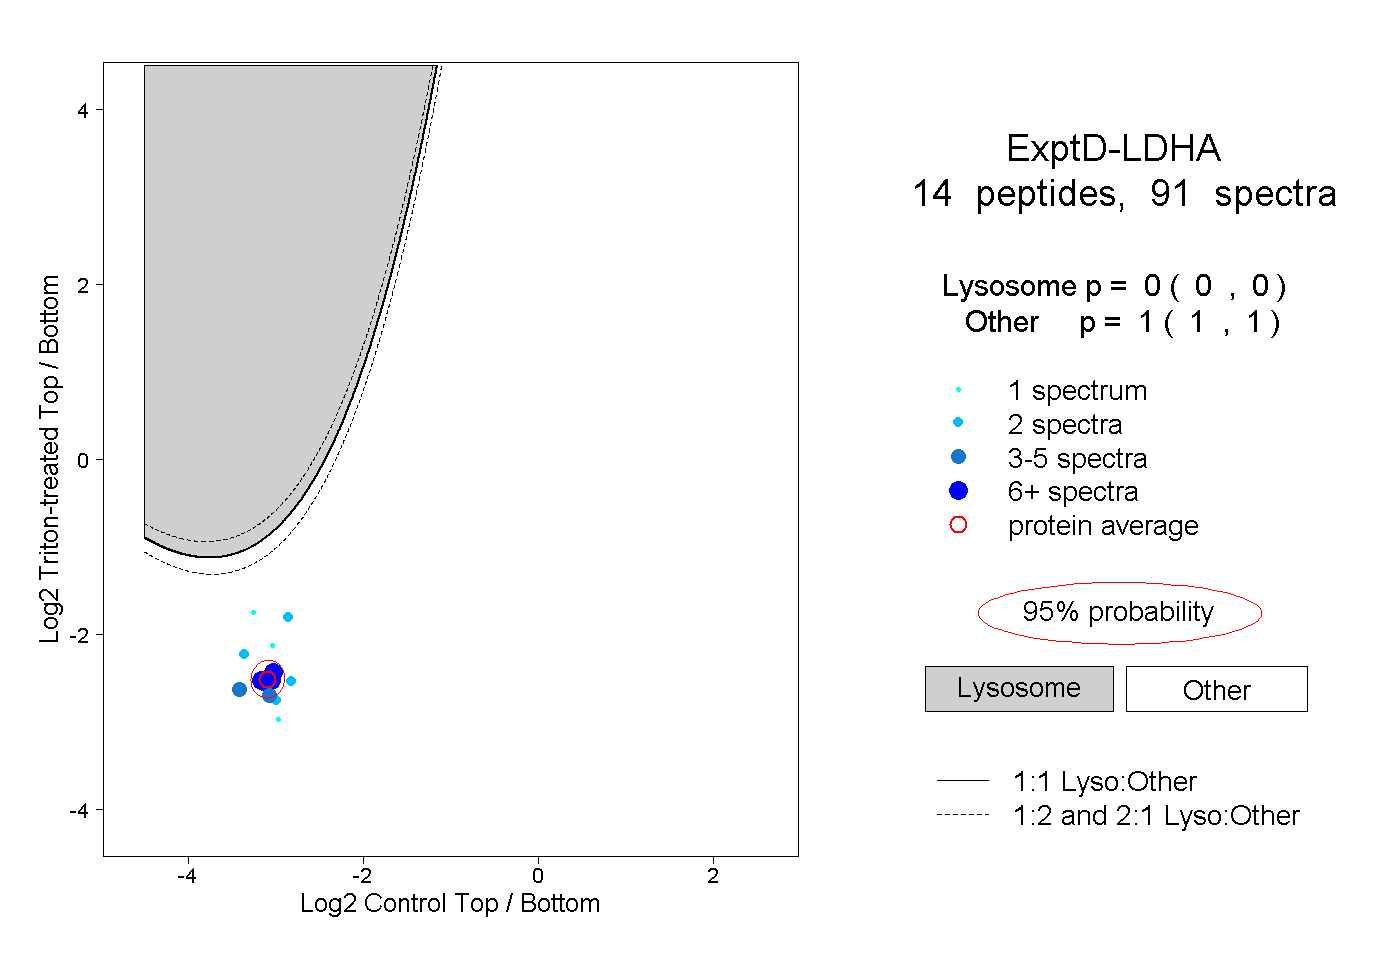
19peptides
spectra
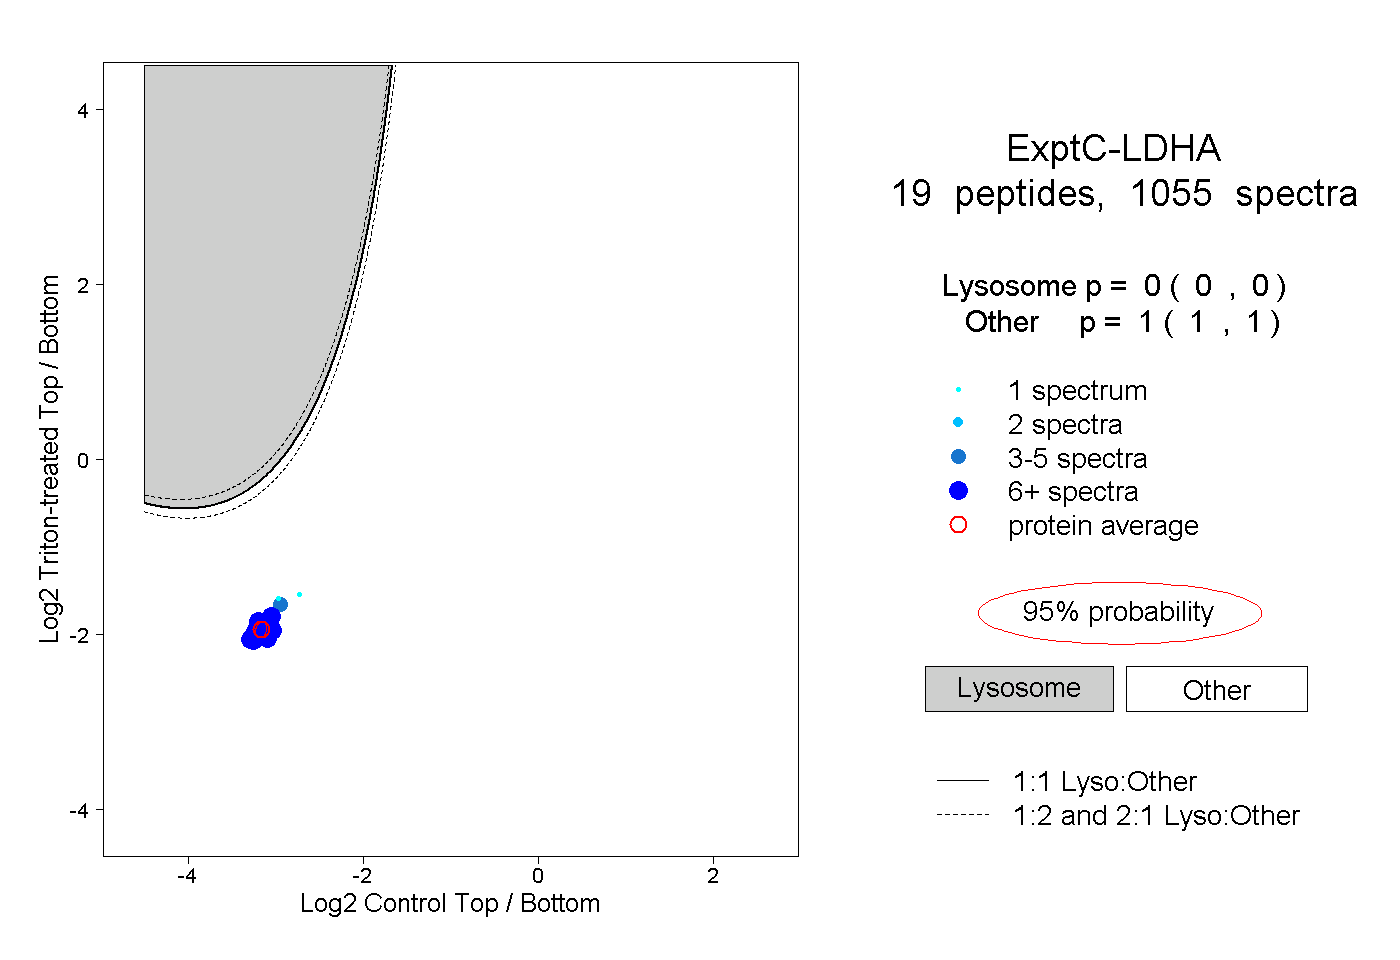
0.000 | 0.000
1.000 | 1.000