 20
20peptides
spectra
0.000 | 0.000
0.000 | 0.000
0.016 | 0.018
0.504 | 0.505
0.000 | 0.000
0.000 | 0.000
0.478 | 0.479
0.000 | 0.000
| Plot | Mito | Lyso | Perox | ER | Golgi | PM | Cytosol | Nucleus | |||||
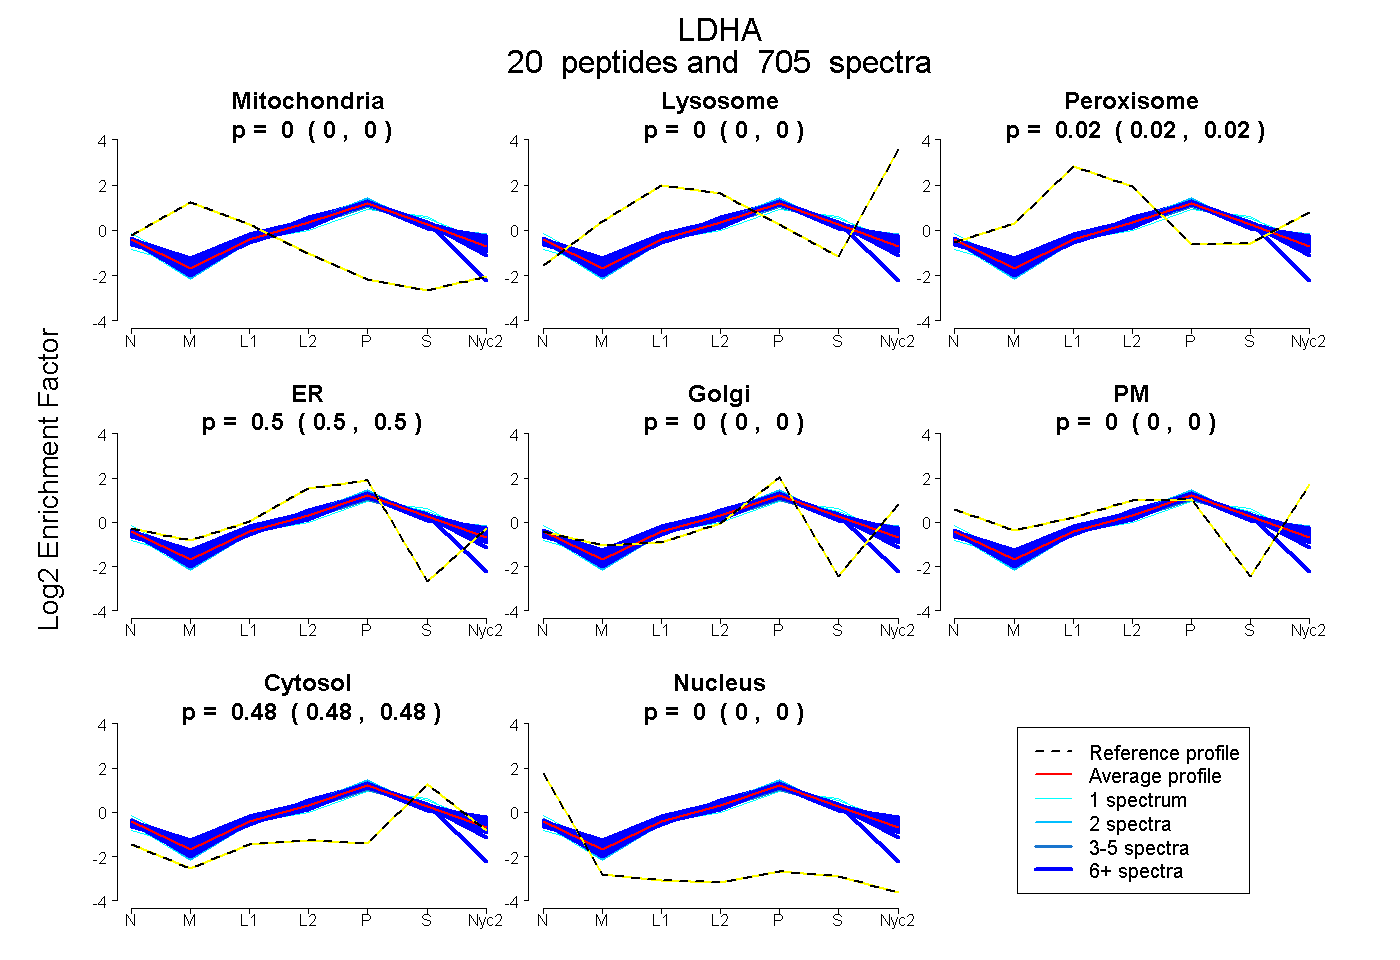
| Expt A |
20 peptides |
705 spectra |
|
0.000 0.000 | 0.000 |
0.000 0.000 | 0.000 |
0.017 0.016 | 0.018 |
0.504 0.504 | 0.505 |
0.000 0.000 | 0.000 |
0.000 0.000 | 0.000 |
0.479 0.478 | 0.479 |
0.000 0.000 | 0.000 |
| 112 spectra, LVIITAGAR | 0.000 | 0.000 | 0.000 | 0.501 | 0.000 | 0.000 | 0.499 | 0.000 | ||
| 46 spectra, LNLVQR | 0.000 | 0.000 | 0.034 | 0.509 | 0.000 | 0.000 | 0.457 | 0.000 | ||
| 34 spectra, FIIPNVVK | 0.000 | 0.000 | 0.039 | 0.493 | 0.000 | 0.000 | 0.467 | 0.000 | ||
| 21 spectra, GLYGIK | 0.000 | 0.000 | 0.016 | 0.504 | 0.000 | 0.000 | 0.480 | 0.000 | ||
| 77 spectra, VIGSGCNLDSAR | 0.000 | 0.000 | 0.000 | 0.508 | 0.000 | 0.000 | 0.492 | 0.000 | ||
| 23 spectra, SADTIWGIQK | 0.000 | 0.000 | 0.117 | 0.420 | 0.069 | 0.000 | 0.394 | 0.000 | ||
| 41 spectra, ISGFPK | 0.000 | 0.000 | 0.040 | 0.453 | 0.040 | 0.000 | 0.467 | 0.000 | ||
| 22 spectra, QVVDSAYEVIK | 0.000 | 0.000 | 0.023 | 0.484 | 0.000 | 0.000 | 0.493 | 0.000 | ||
| 1 spectrum, DLADELALVDVIEDK | 0.000 | 0.000 | 0.000 | 0.413 | 0.000 | 0.000 | 0.587 | 0.000 | ||
| 36 spectra, YSPQCK | 0.000 | 0.000 | 0.000 | 0.461 | 0.000 | 0.000 | 0.530 | 0.008 | ||
| 32 spectra, DYSVTANSK | 0.000 | 0.000 | 0.000 | 0.491 | 0.000 | 0.000 | 0.509 | 0.000 | ||
| 1 spectrum, GEMMDLQHGSLFLK | 0.000 | 0.000 | 0.087 | 0.373 | 0.039 | 0.000 | 0.502 | 0.000 | ||
| 33 spectra, DQLIVNLLK | 0.000 | 0.000 | 0.000 | 0.503 | 0.000 | 0.000 | 0.497 | 0.000 | ||
| 23 spectra, NVNIFK | 0.000 | 0.000 | 0.021 | 0.530 | 0.000 | 0.000 | 0.449 | 0.000 | ||
| 92 spectra, VTLTPDEEAR | 0.000 | 0.000 | 0.000 | 0.523 | 0.000 | 0.000 | 0.477 | 0.000 | ||
| 2 spectra, SLNPQLGTDADK | 0.000 | 0.003 | 0.000 | 0.442 | 0.112 | 0.000 | 0.444 | 0.000 | ||
| 34 spectra, YLMGER | 0.000 | 0.000 | 0.047 | 0.501 | 0.000 | 0.000 | 0.452 | 0.000 | ||
| 5 spectra, EEQVPQNK | 0.000 | 0.000 | 0.047 | 0.455 | 0.006 | 0.000 | 0.492 | 0.000 | ||
| 69 spectra, VHPISTMIK | 0.000 | 0.000 | 0.106 | 0.359 | 0.126 | 0.000 | 0.409 | 0.000 | ||
| 1 spectrum, GYTSWAIGLSVADLAESIMK | 0.000 | 0.000 | 0.099 | 0.356 | 0.105 | 0.007 | 0.433 | 0.000 |
| Plot | Mito | Lyso or Perox | ER | Golgi | PM | Cytosol | Nucleus | ||||||
| Expt B |
19 peptides |
216 spectra |
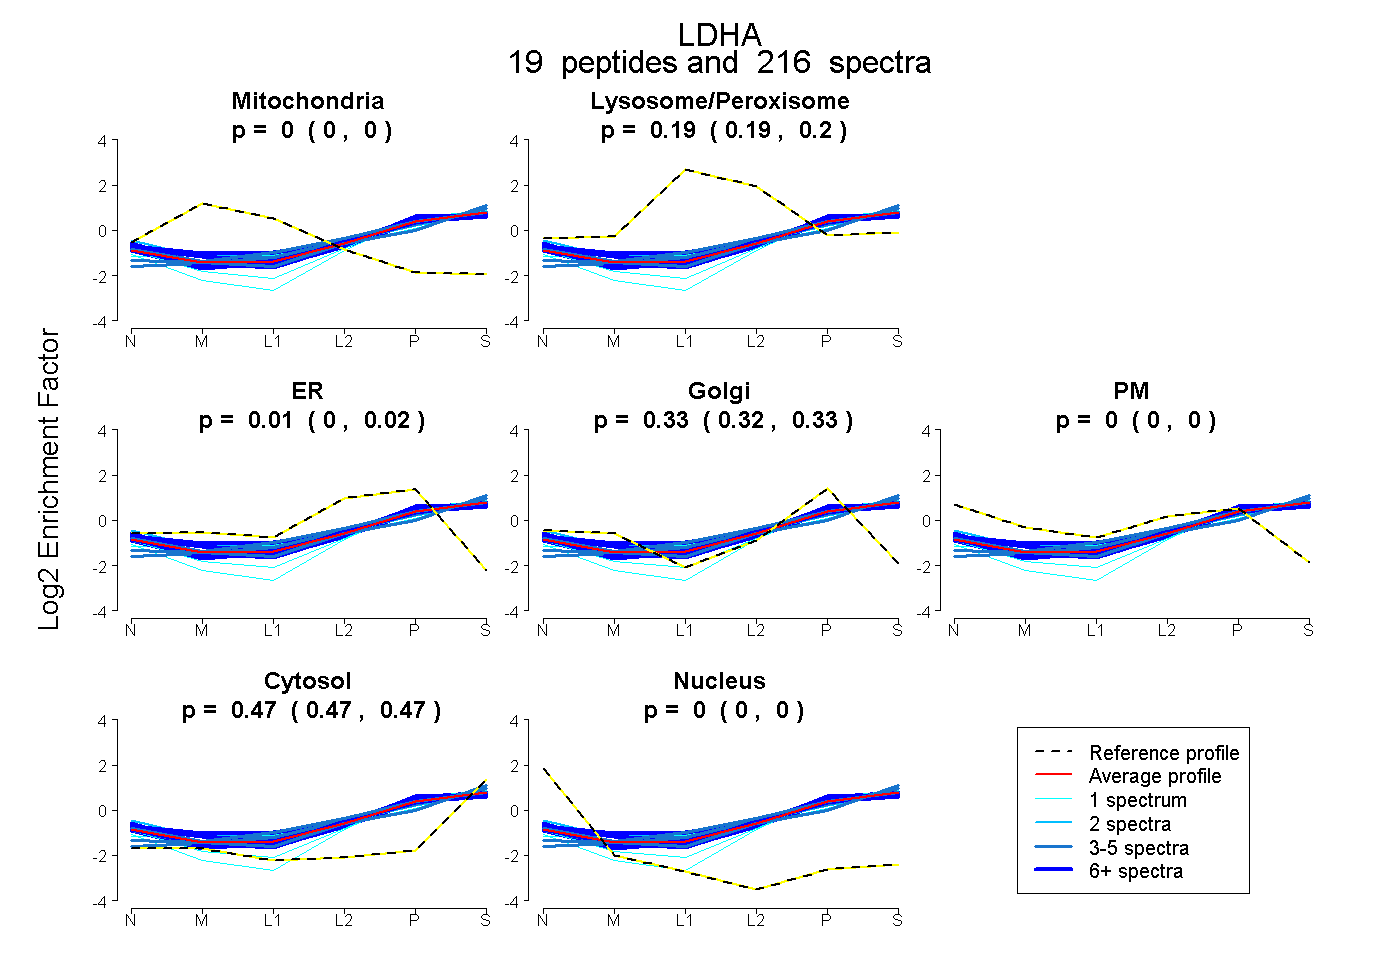 |
0.000 0.000 | 0.000 |
0.194 0.191 | 0.197 |
0.009 0.003 | 0.015 |
0.325 0.320 | 0.330 |
0.000 0.000 | 0.000 |
0.471 0.469 | 0.473 |
0.000 0.000 | 0.000 |
|||
| Plot | Lyso | Other | |||||||||||
| Expt C |
19 peptides |
1055 spectra |
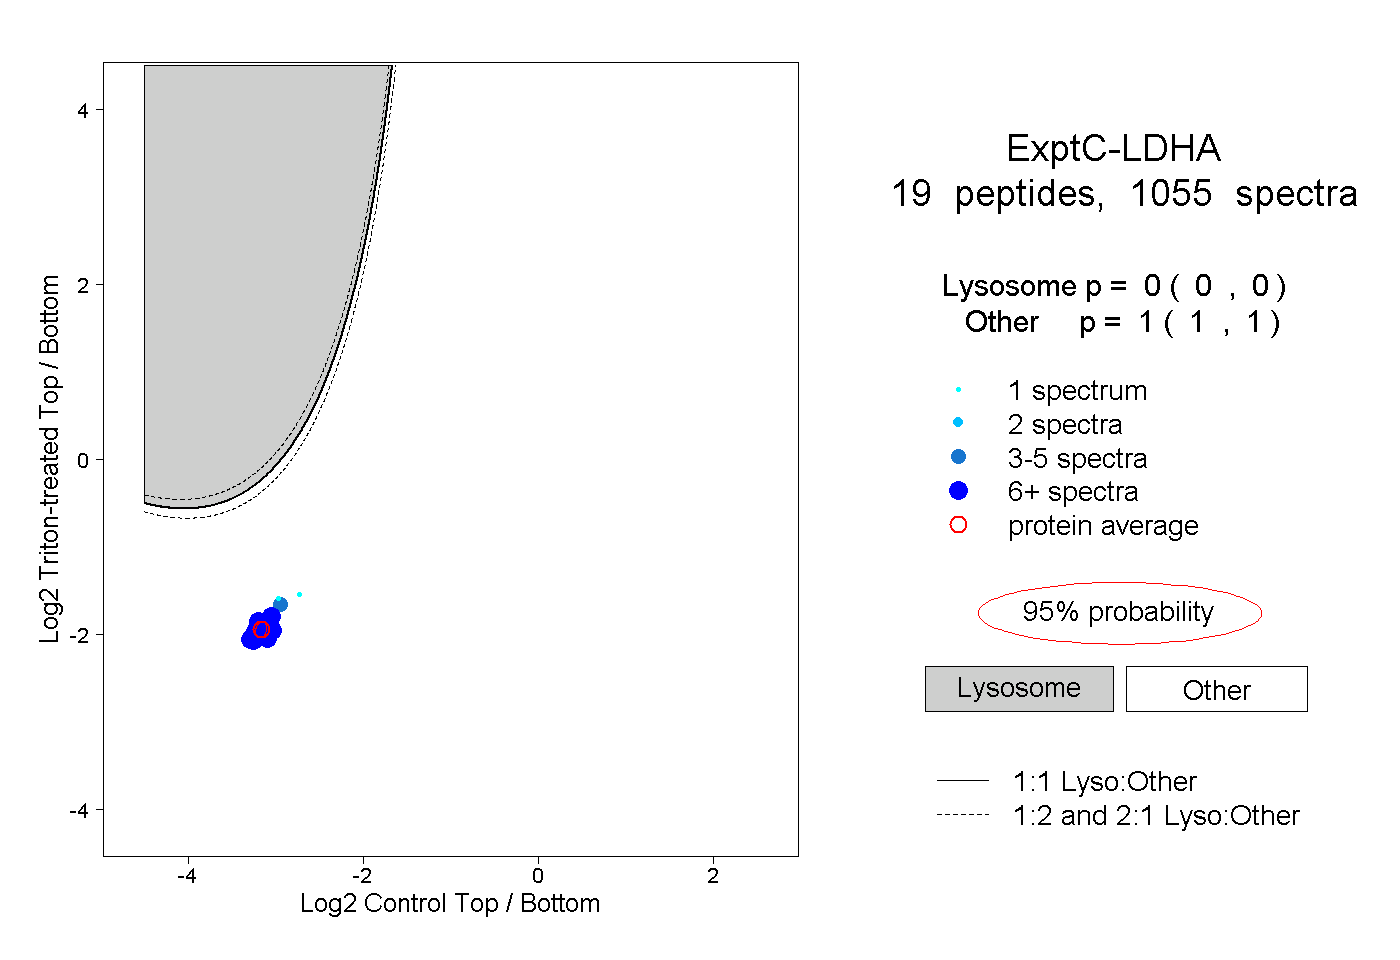 |
0.000 0.000 | 0.000 |
1.000 1.000 | 1.000 |
||||||||
| Plot | Lyso | Other | |||||||||||
| Expt D |
14 peptides |
91 spectra |
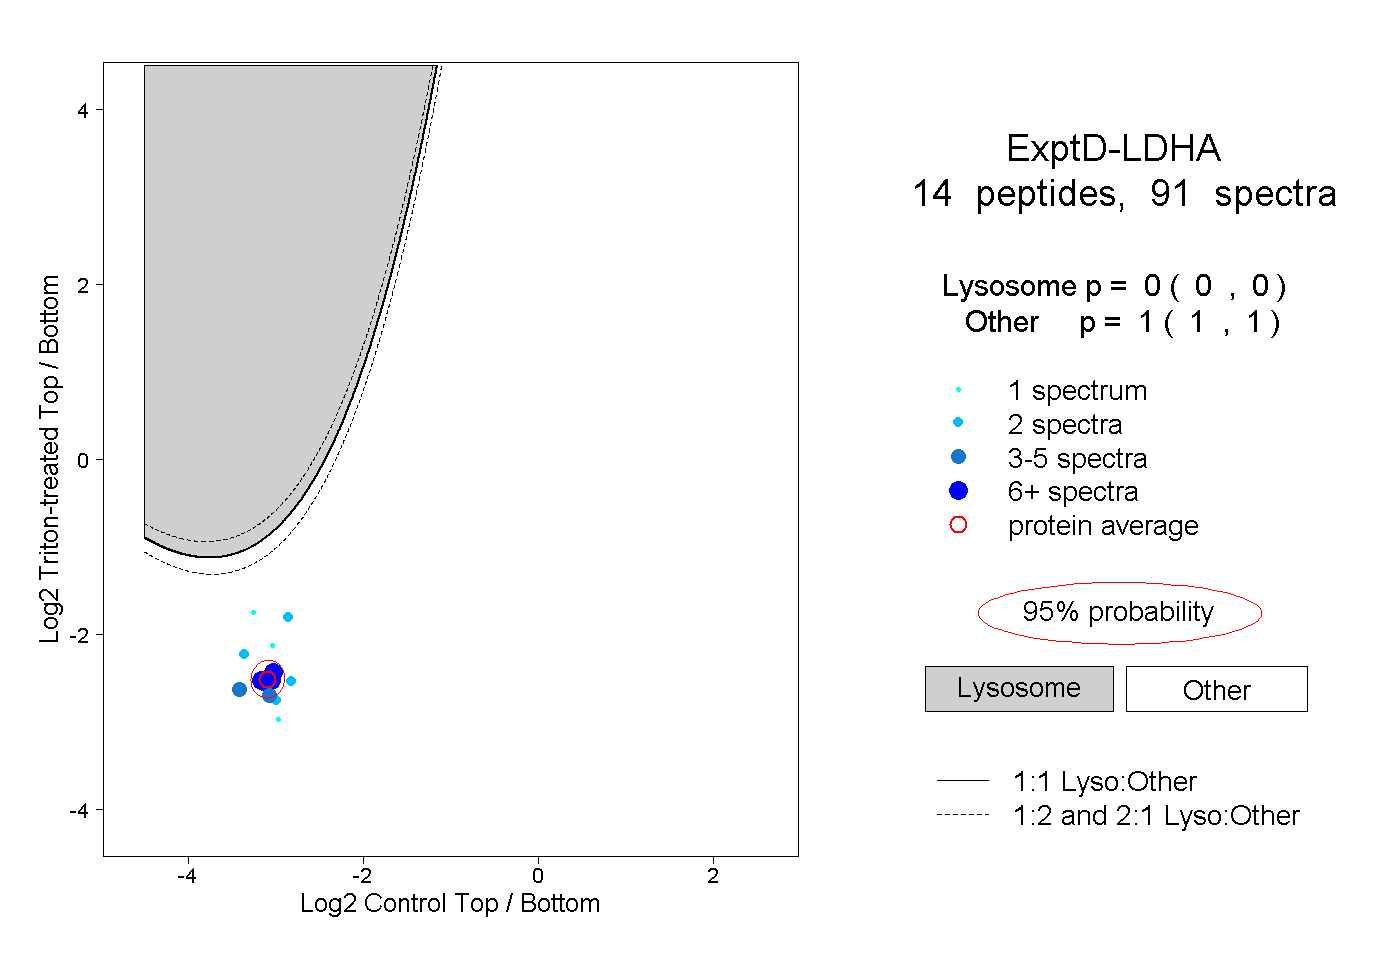 |
0.000 0.000 | 0.000 |
1.000 1.000 | 1.000 |