 3
3peptides
spectra
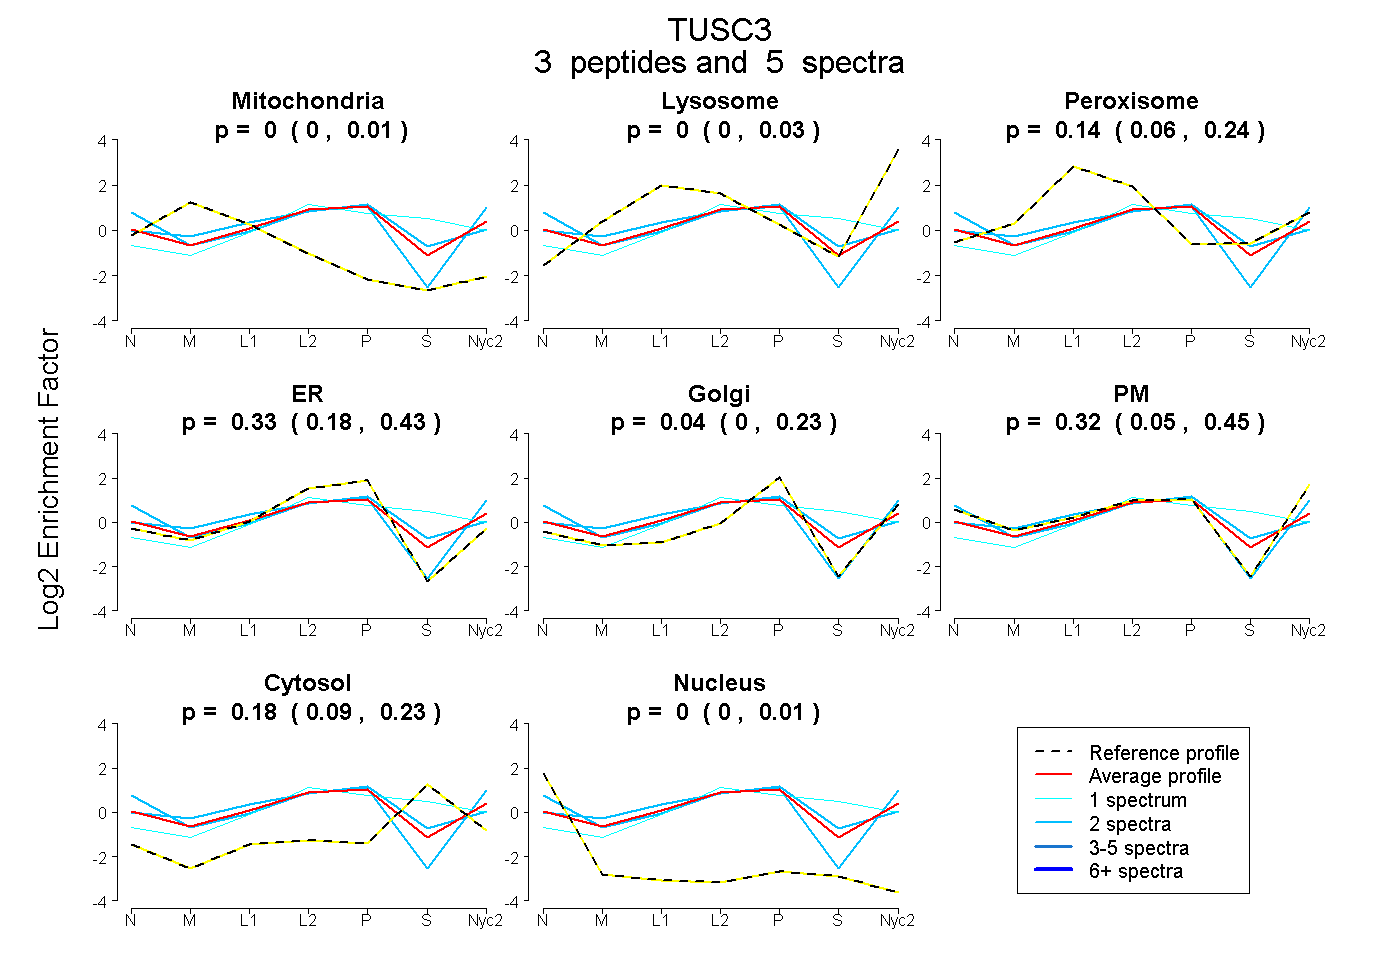
0.000 | 0.008
0.000 | 0.027
0.065 | 0.239
0.176 | 0.425
0.000 | 0.227
0.053 | 0.449
0.093 | 0.234
0.000 | 0.011
1peptide
spectrum
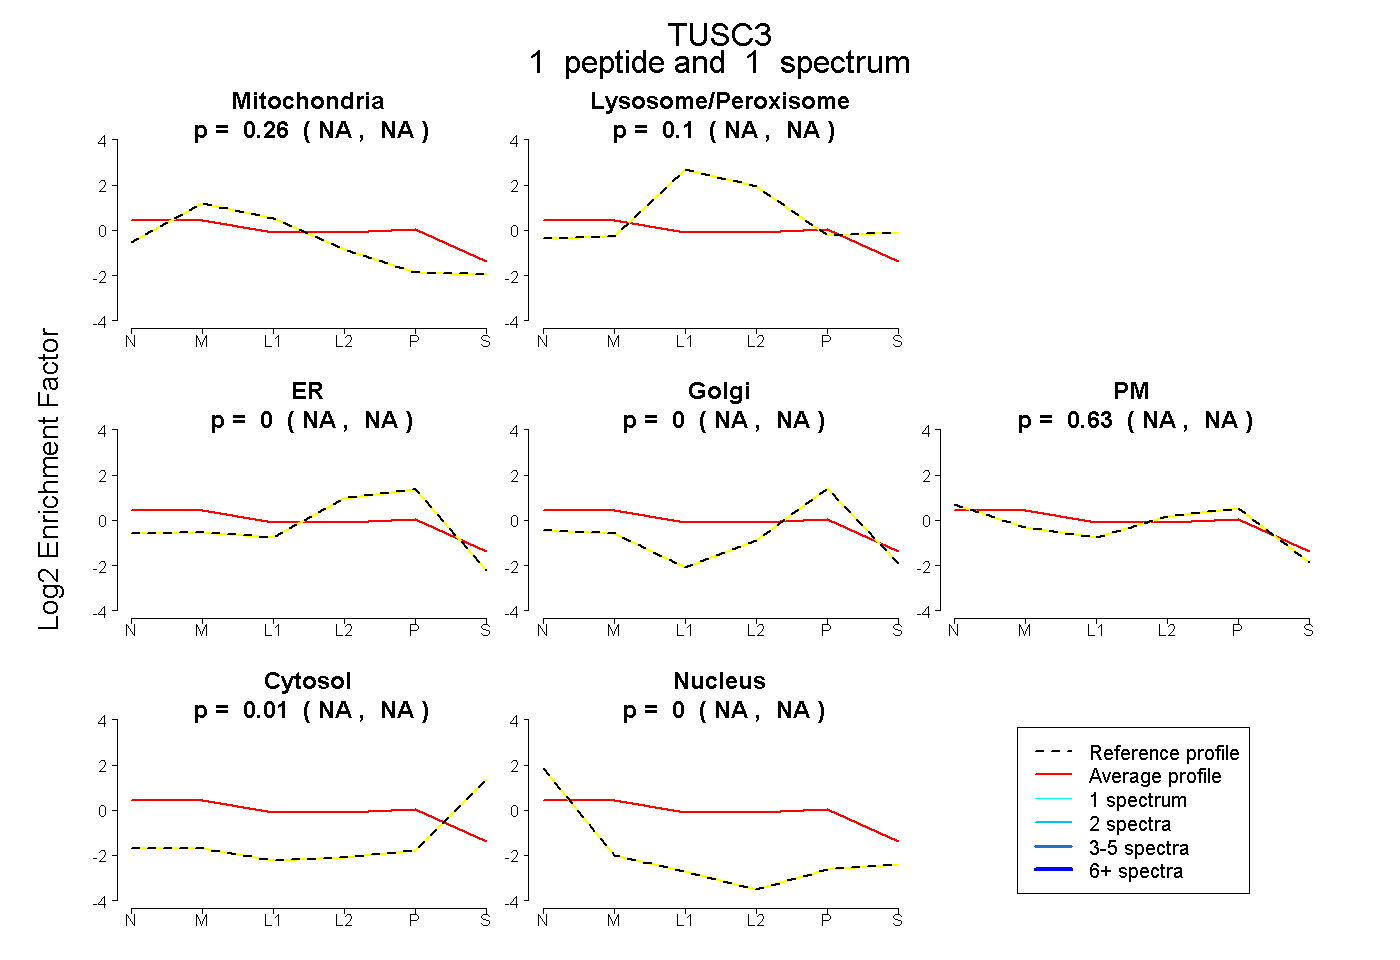
NA | NA
NA | NA
NA | NA
NA | NA
NA | NA
NA | NA
NA | NA
1peptide
spectrum
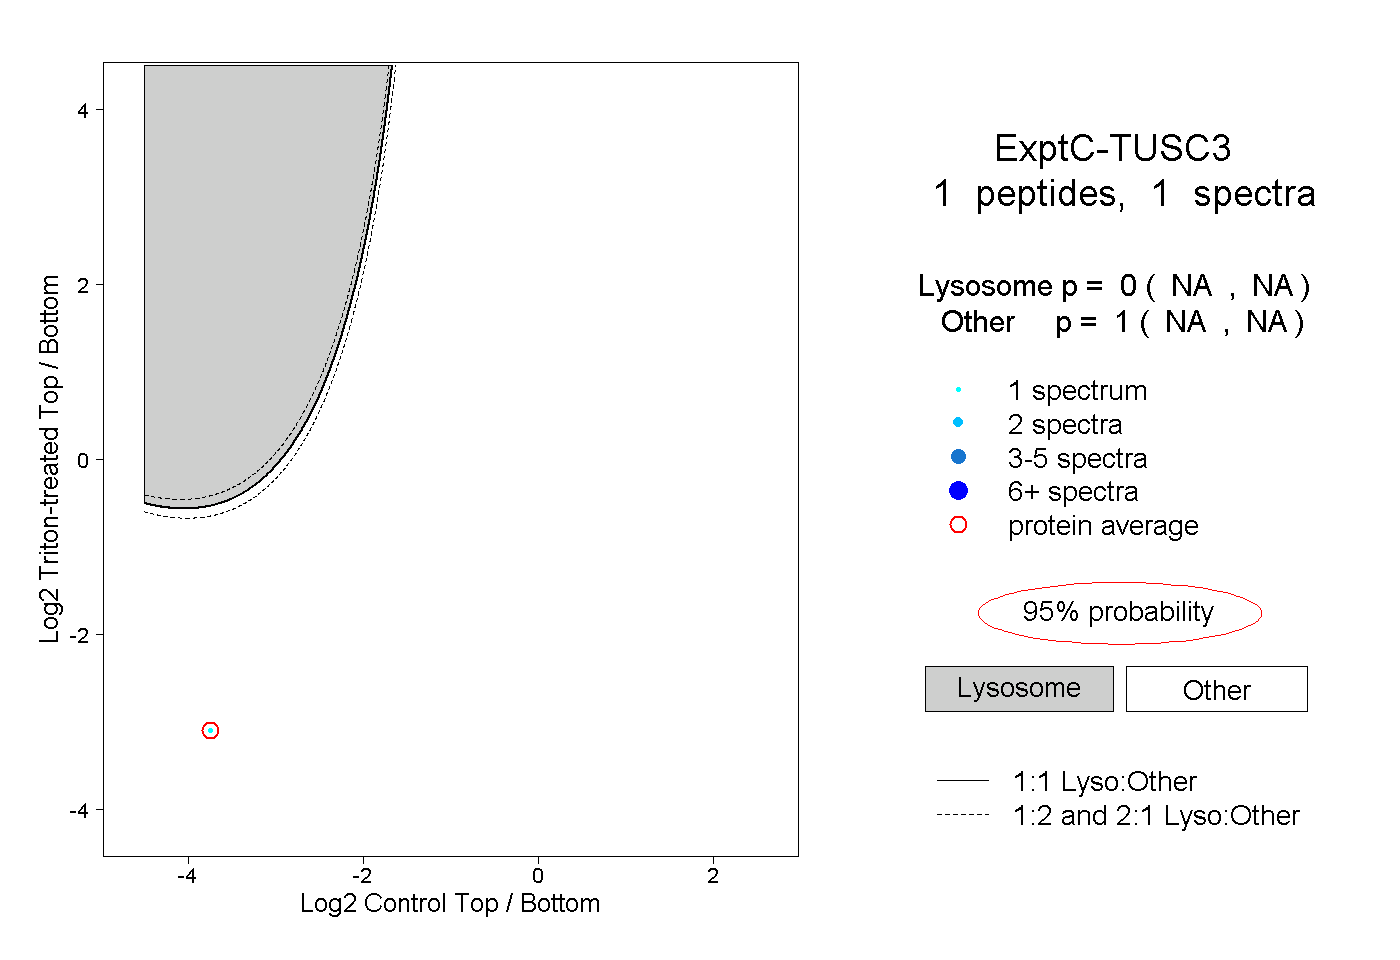
NA | NA
NA | NA