 6
6peptides
spectra
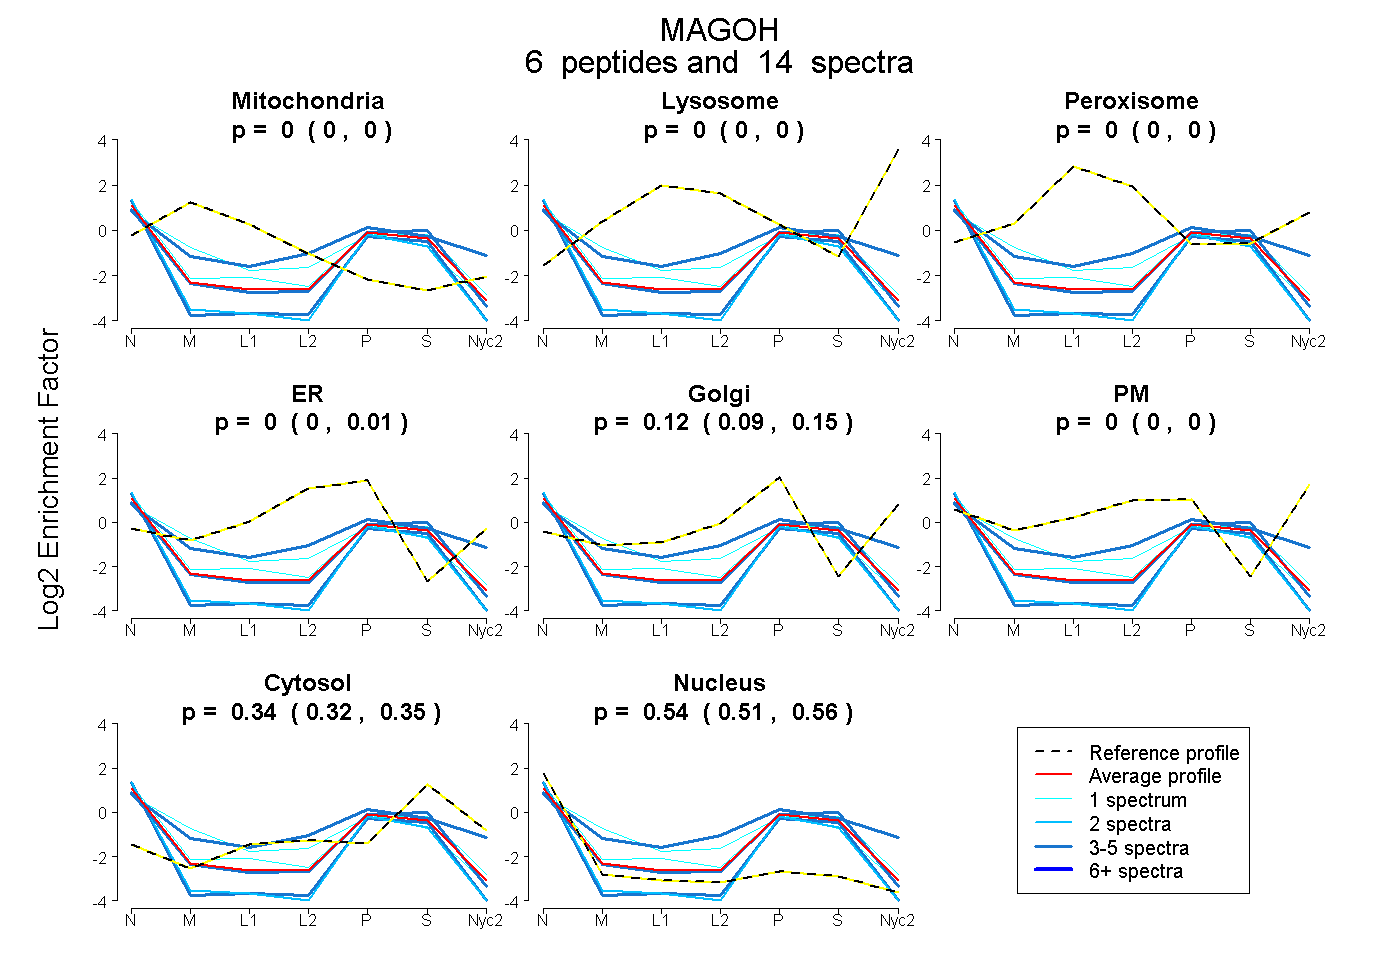
0.000 | 0.000
0.000 | 0.000
0.000 | 0.000
0.000 | 0.009
0.092 | 0.145
0.000 | 0.000
0.324 | 0.353
0.510 | 0.556
| Plot | Mito | Lyso | Perox | ER | Golgi | PM | Cytosol | Nucleus | |||||
| Expt A |
6 peptides |
14 spectra |
|
0.000 0.000 | 0.000 |
0.000 0.000 | 0.000 |
0.000 0.000 | 0.000 |
0.000 0.000 | 0.009 |
0.124 0.092 | 0.145 |
0.000 0.000 | 0.000 |
0.339 0.324 | 0.353 |
0.537 0.510 | 0.556 |
| 3 spectra, YYVGHK | 0.000 | 0.000 | 0.000 | 0.000 | 0.061 | 0.000 | 0.419 | 0.520 | ||
| 1 spectrum, EAYVHK | 0.152 | 0.000 | 0.000 | 0.171 | 0.000 | 0.000 | 0.353 | 0.324 | ||
| 3 spectra, NDVMIR | 0.000 | 0.000 | 0.000 | 0.062 | 0.158 | 0.176 | 0.376 | 0.227 | ||
| 1 spectrum, EDDALWPPPDR | 0.000 | 0.000 | 0.000 | 0.125 | 0.050 | 0.000 | 0.264 | 0.561 | ||
| 2 spectra, YANNSNYK | 0.000 | 0.000 | 0.000 | 0.000 | 0.000 | 0.000 | 0.226 | 0.774 | ||
| 4 spectra, FGHEFLEFEFRPDGK | 0.000 | 0.000 | 0.000 | 0.000 | 0.000 | 0.000 | 0.256 | 0.744 |
| Plot | Lyso | Other | |||||||||||
| Expt C |
1 peptide |
1 spectrum |
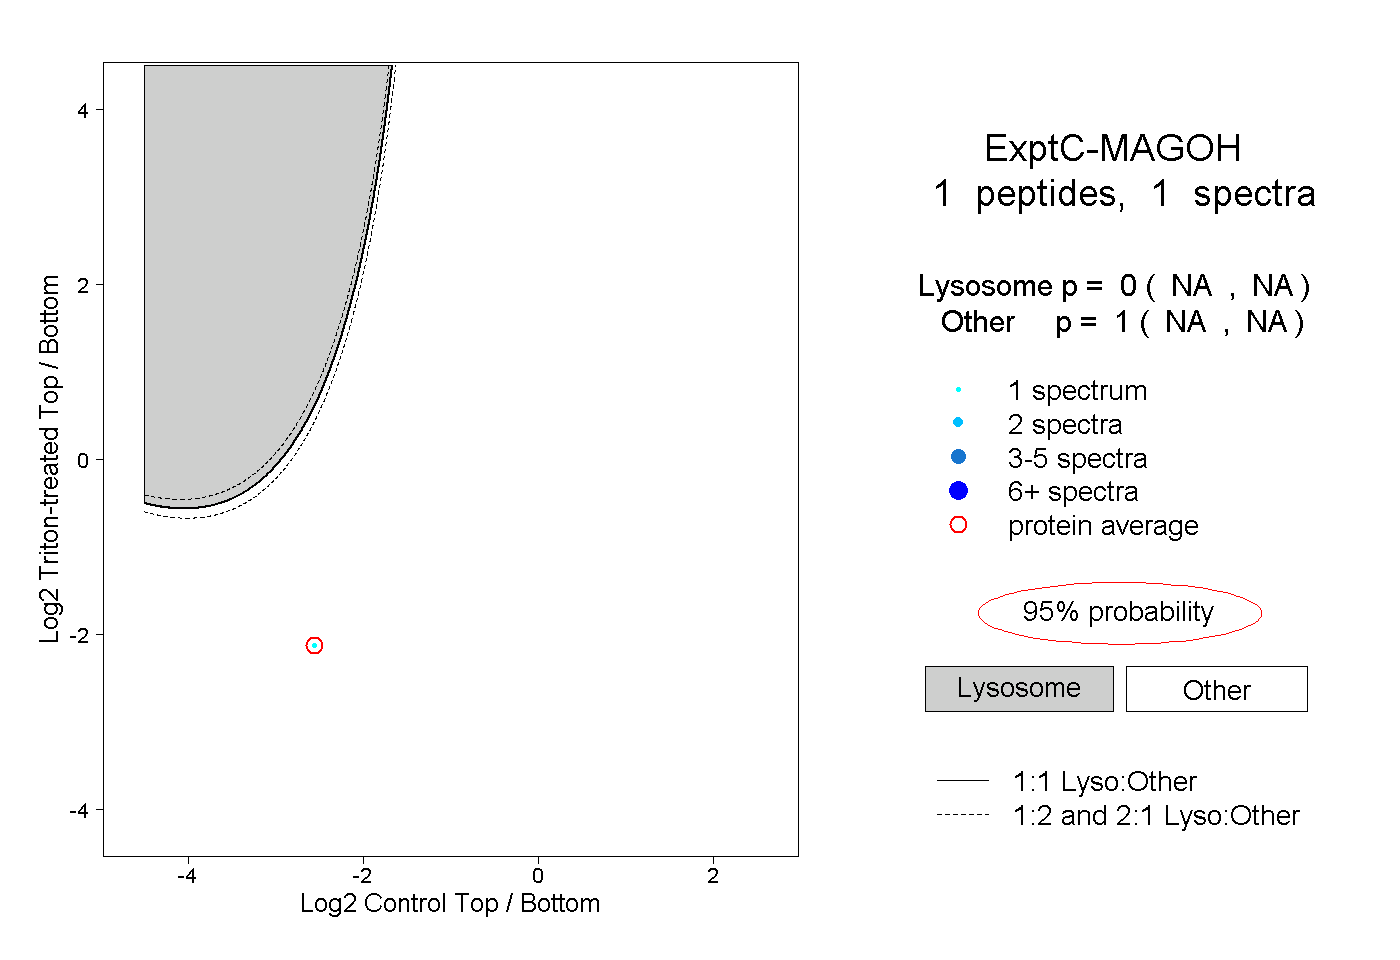 |
0.000 NA | NA |
1.000 NA | NA |