 3
3peptides
spectra
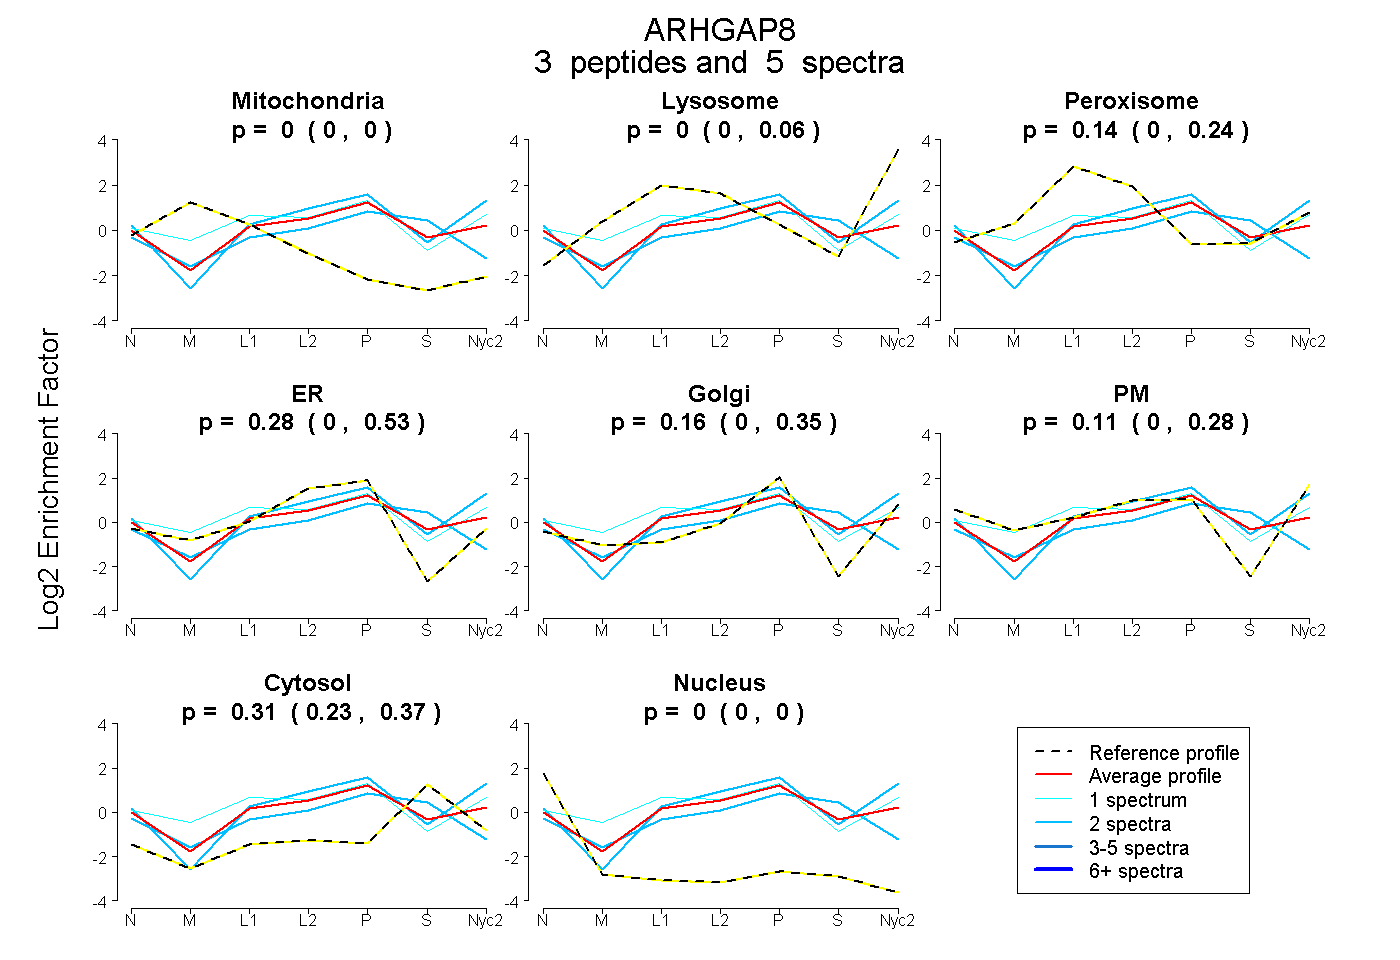
0.000 | 0.000
0.000 | 0.058
0.004 | 0.236
0.000 | 0.525
0.000 | 0.349
0.000 | 0.281
0.225 | 0.375
0.000 | 0.000
| Plot | Mito | Lyso | Perox | ER | Golgi | PM | Cytosol | Nucleus | |||||
| Expt A |
3 peptides |
5 spectra |
|
0.000 0.000 | 0.000 |
0.000 0.000 | 0.058 |
0.145 0.004 | 0.236 |
0.282 0.000 | 0.525 |
0.159 0.000 | 0.349 |
0.107 0.000 | 0.281 |
0.306 0.225 | 0.375 |
0.000 0.000 | 0.000 |
| 2 spectra, LPPLHQLNHQR | 0.000 | 0.093 | 0.000 | 0.183 | 0.093 | 0.373 | 0.258 | 0.000 | ||
| 1 spectrum, WTVTYLR | 0.000 | 0.000 | 0.389 | 0.000 | 0.512 | 0.045 | 0.055 | 0.000 | ||
| 2 spectra, IFTFSCCR | 0.000 | 0.000 | 0.040 | 0.425 | 0.000 | 0.000 | 0.534 | 0.000 |
| Plot | Lyso | Other | |||||||||||
| Expt C |
2 peptides |
3 spectra |
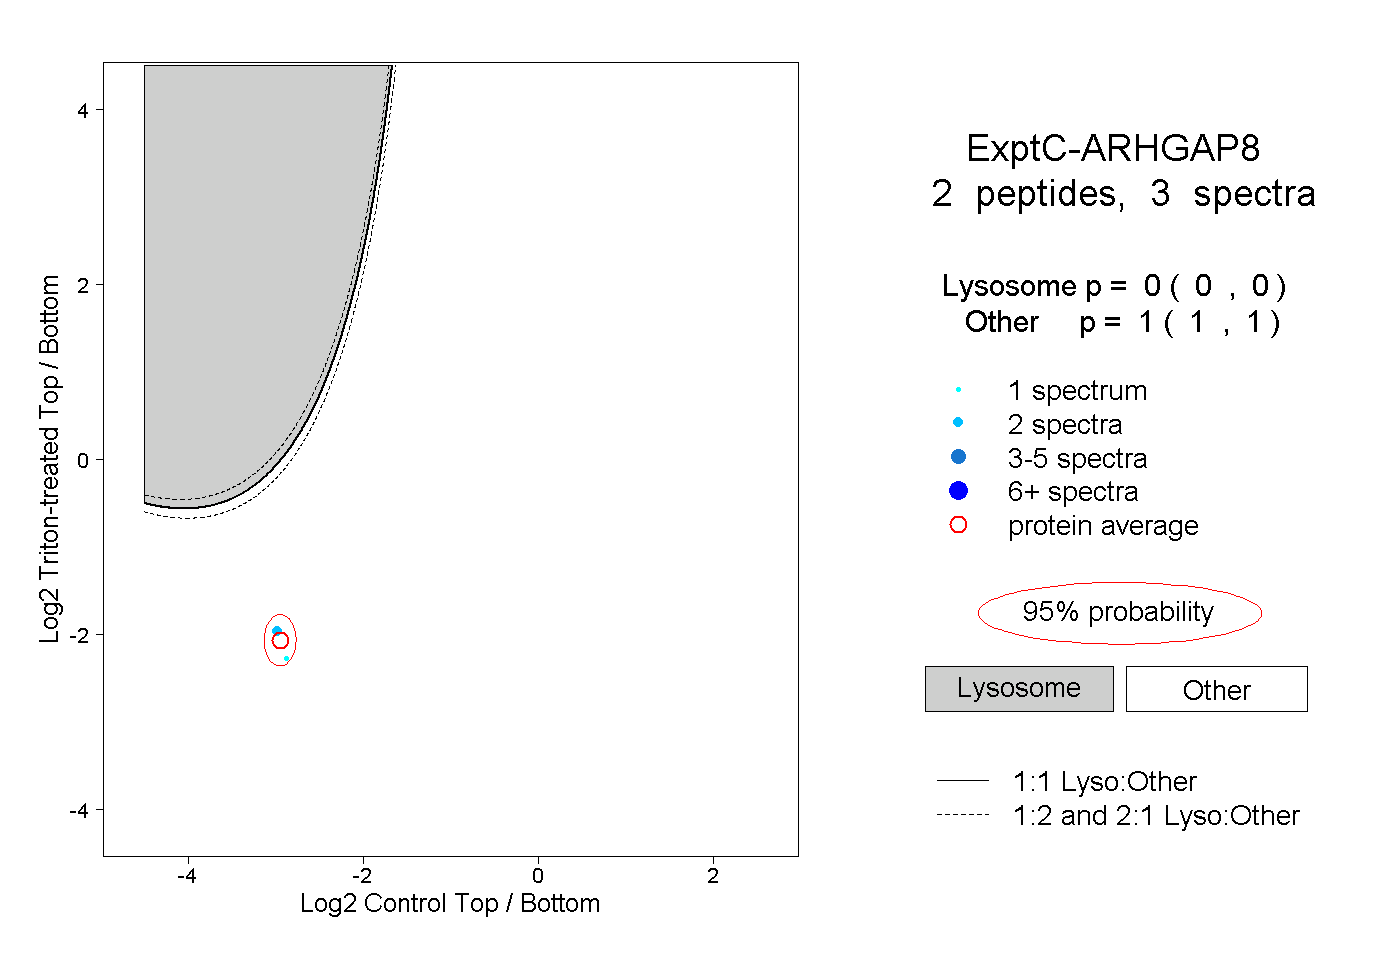 |
0.000 0.000 | 0.000 |
1.000 1.000 | 1.000 |