 4
4peptides
spectra
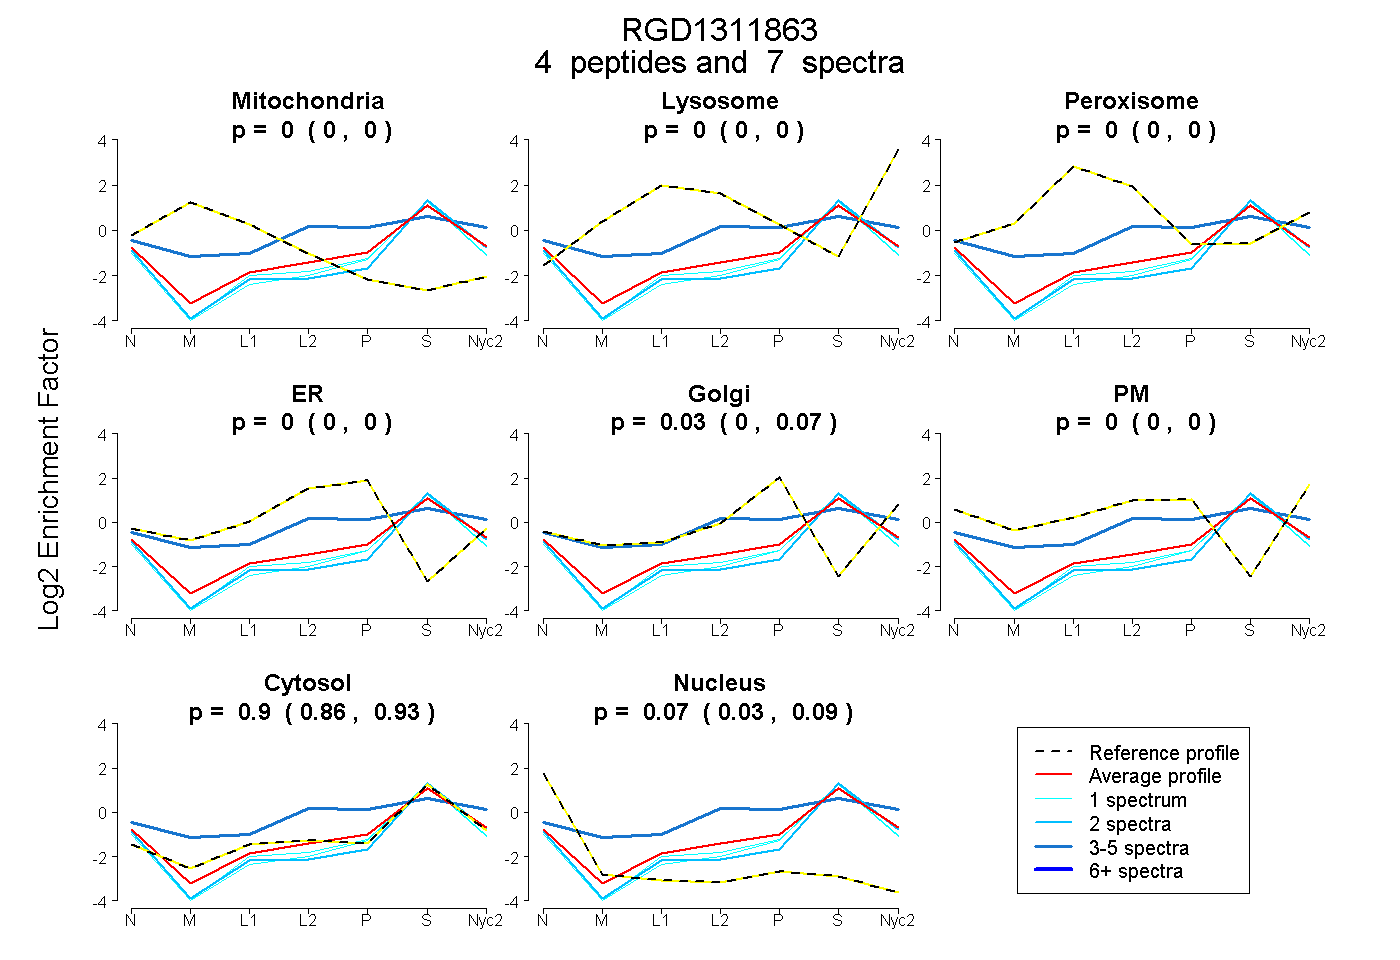
0.000 | 0.000
0.000 | 0.000
0.000 | 0.000
0.000 | 0.000
0.000 | 0.069
0.000 | 0.000
0.864 | 0.932
0.033 | 0.094
| Plot | Mito | Lyso | Perox | ER | Golgi | PM | Cytosol | Nucleus | |||||
| Expt A |
4 peptides |
7 spectra |
|
0.000 0.000 | 0.000 |
0.000 0.000 | 0.000 |
0.000 0.000 | 0.000 |
0.000 0.000 | 0.000 |
0.030 0.000 | 0.069 |
0.000 0.000 | 0.000 |
0.905 0.864 | 0.932 |
0.066 0.033 | 0.094 |
| 3 spectra, VINAFR | 0.000 | 0.029 | 0.043 | 0.086 | 0.000 | 0.266 | 0.575 | 0.000 | ||
| 1 spectrum, LGSAAPAGPPVR | 0.000 | 0.000 | 0.000 | 0.000 | 0.000 | 0.000 | 0.889 | 0.111 | ||
| 2 spectra, VNILVPGAGLGR | 0.000 | 0.000 | 0.000 | 0.000 | 0.000 | 0.000 | 0.887 | 0.113 | ||
| 1 spectrum, LLPQFPLHLDK | 0.000 | 0.000 | 0.000 | 0.000 | 0.000 | 0.000 | 0.887 | 0.113 |
| Plot | Mito | Lyso or Perox | ER | Golgi | PM | Cytosol | Nucleus | ||||||
| Expt B |
1 peptide |
1 spectrum |
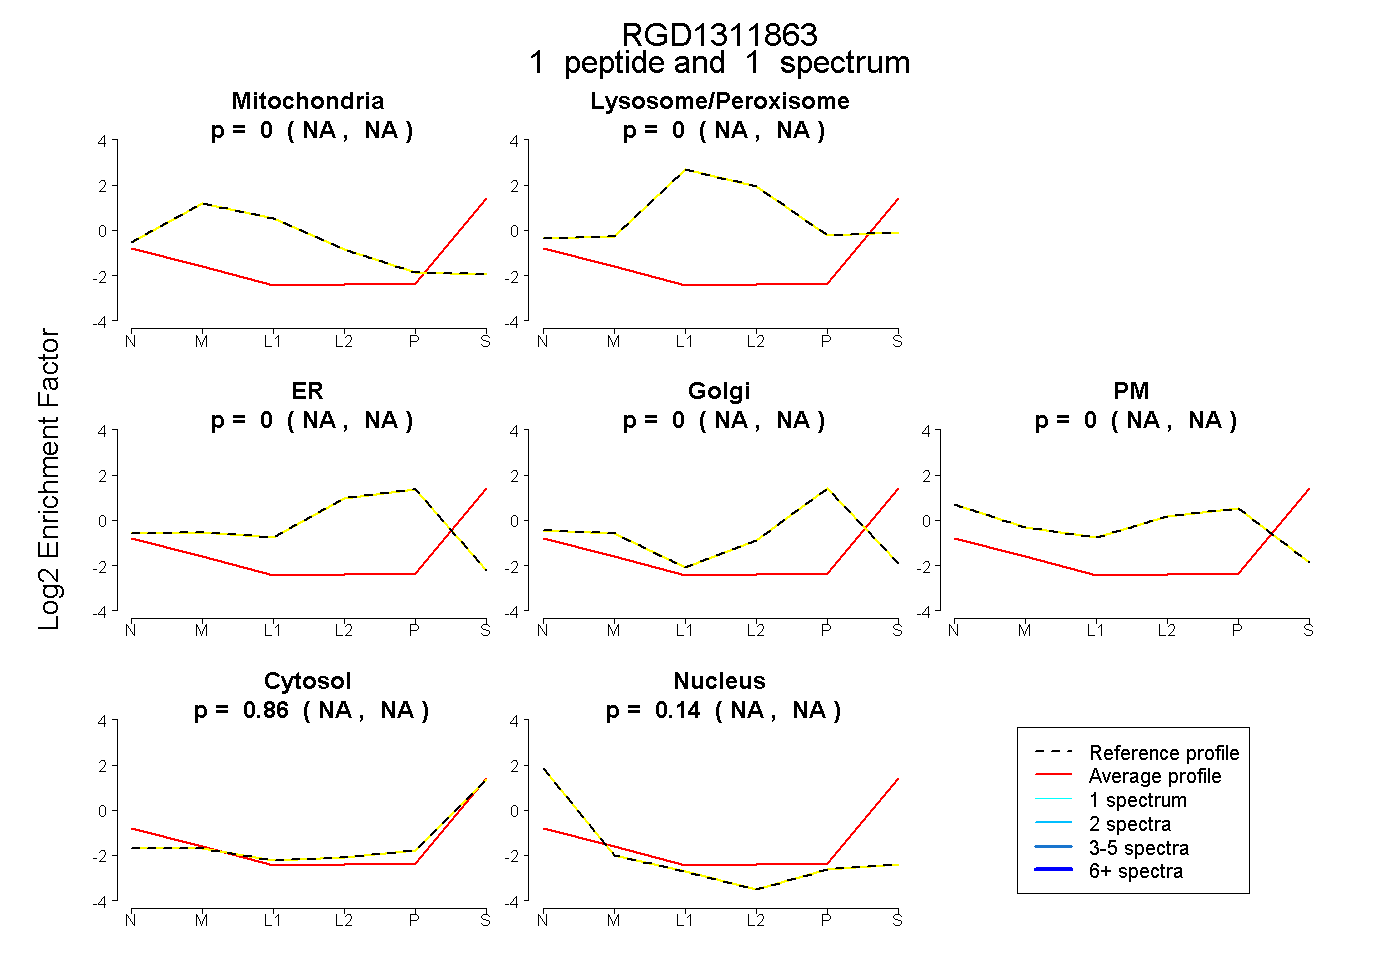 |
0.000 NA | NA |
0.000 NA | NA |
0.000 NA | NA |
0.000 NA | NA |
0.000 NA | NA |
0.859 NA | NA |
0.141 NA | NA |
|||
| Plot | Lyso | Other | |||||||||||
| Expt C |
1 peptide |
1 spectrum |
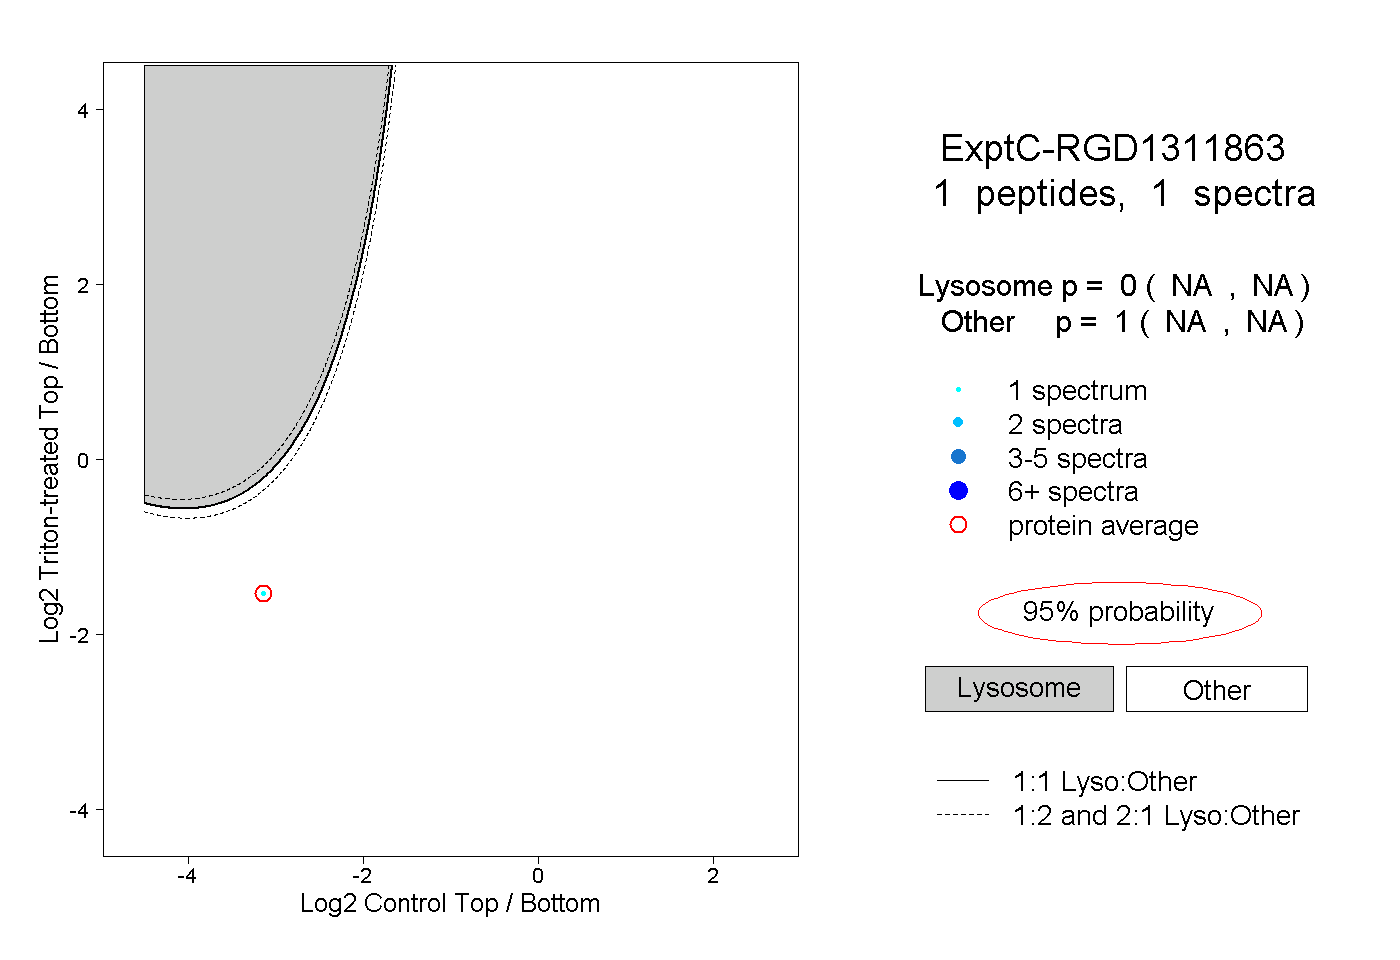 |
0.000 NA | NA |
1.000 NA | NA |