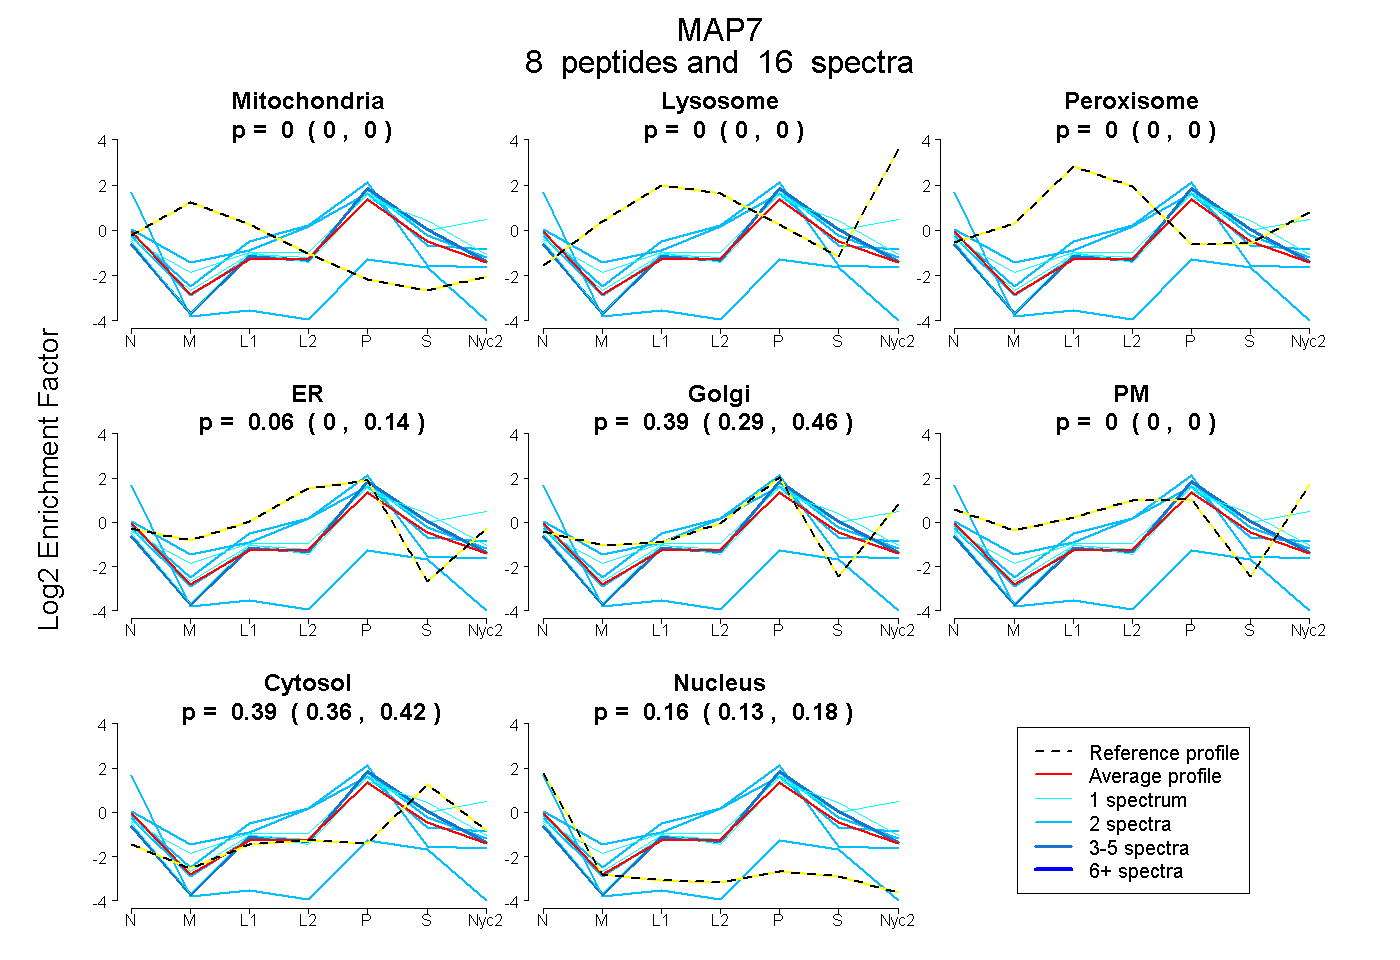
 8
8peptides
spectra
0.000 | 0.000
0.000 | 0.000
0.000 | 0.000
0.000 | 0.140
0.286 | 0.463
0.000 | 0.000
0.365 | 0.419
0.129 | 0.178
| Plot | Mito | Lyso | Perox | ER | Golgi | PM | Cytosol | Nucleus | |||||
| Expt A |
8 peptides |
16 spectra |
|
0.000 0.000 | 0.000 |
0.000 0.000 | 0.000 |
0.000 0.000 | 0.000 |
0.059 0.000 | 0.140 |
0.392 0.286 | 0.463 |
0.000 0.000 | 0.000 |
0.394 0.365 | 0.419 |
0.155 0.129 | 0.178 |
| 1 spectrum, VTIESSPDLEK | 0.000 | 0.000 | 0.000 | 0.000 | 0.344 | 0.000 | 0.624 | 0.032 | ||
| 1 spectrum, TLSPSNLK | 0.000 | 0.000 | 0.000 | 0.000 | 0.562 | 0.000 | 0.438 | 0.000 | ||
| 2 spectra, ILAEK | 0.000 | 0.000 | 0.000 | 0.000 | 0.000 | 0.000 | 0.084 | 0.916 | ||
| 2 spectra, LFITPPEGSAR | 0.000 | 0.000 | 0.000 | 0.000 | 0.488 | 0.000 | 0.428 | 0.084 | ||
| 5 spectra, TSAGTTDPEEATR | 0.000 | 0.000 | 0.000 | 0.000 | 0.410 | 0.000 | 0.531 | 0.059 | ||
| 2 spectra, ETVWLER | 0.000 | 0.000 | 0.000 | 0.695 | 0.000 | 0.000 | 0.186 | 0.119 | ||
| 2 spectra, HEAVVR | 0.000 | 0.000 | 0.000 | 0.484 | 0.170 | 0.000 | 0.320 | 0.025 | ||
| 1 spectrum, NPVDRPK | 0.000 | 0.000 | 0.000 | 0.221 | 0.259 | 0.000 | 0.470 | 0.049 |
| Plot | Mito | Lyso or Perox | ER | Golgi | PM | Cytosol | Nucleus | ||||||
| Expt B |
1 peptide |
1 spectrum |
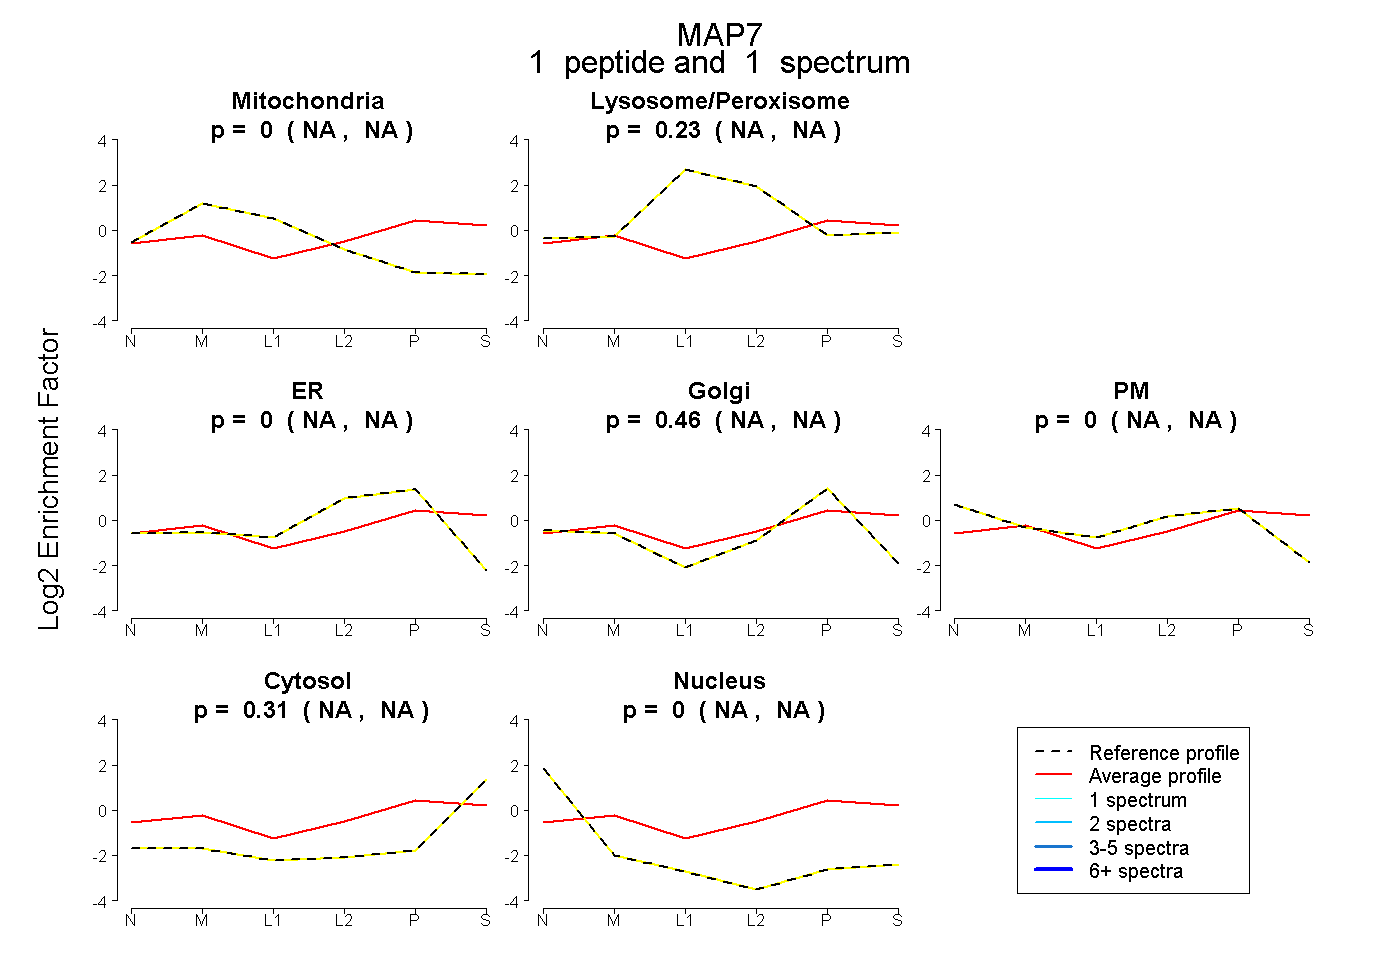 |
0.000 NA | NA |
0.234 NA | NA |
0.000 NA | NA |
0.458 NA | NA |
0.000 NA | NA |
0.308 NA | NA |
0.000 NA | NA |
|||
| Plot | Lyso | Other | |||||||||||
| Expt C |
4 peptides |
11 spectra |
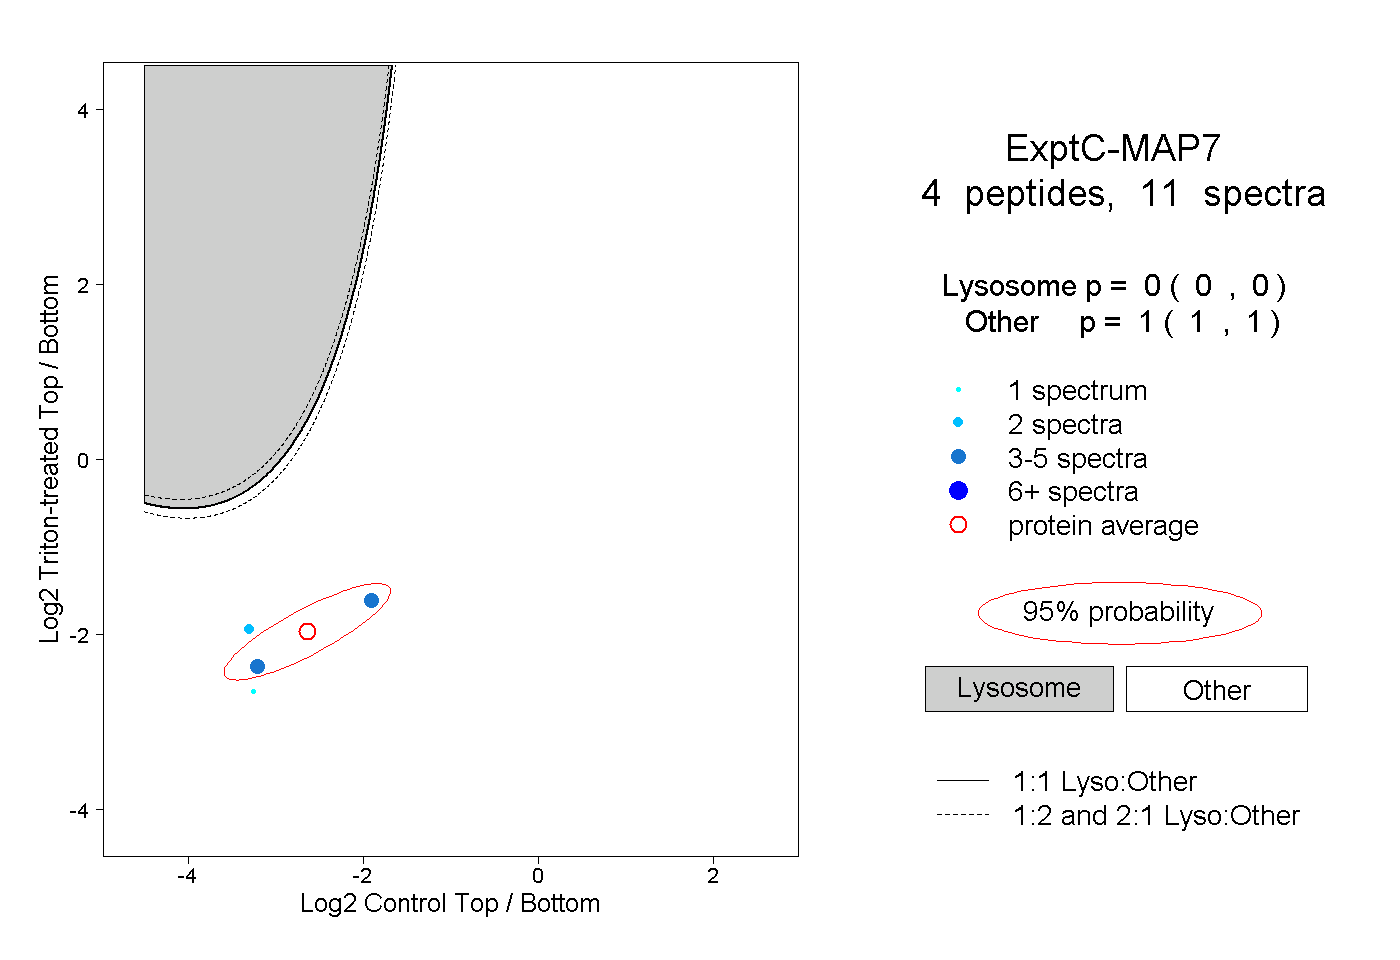 |
0.000 0.000 | 0.000 |
1.000 1.000 | 1.000 |
||||||||
| Plot | Lyso | Other | |||||||||||
| Expt D |
1 peptide |
2 spectra |
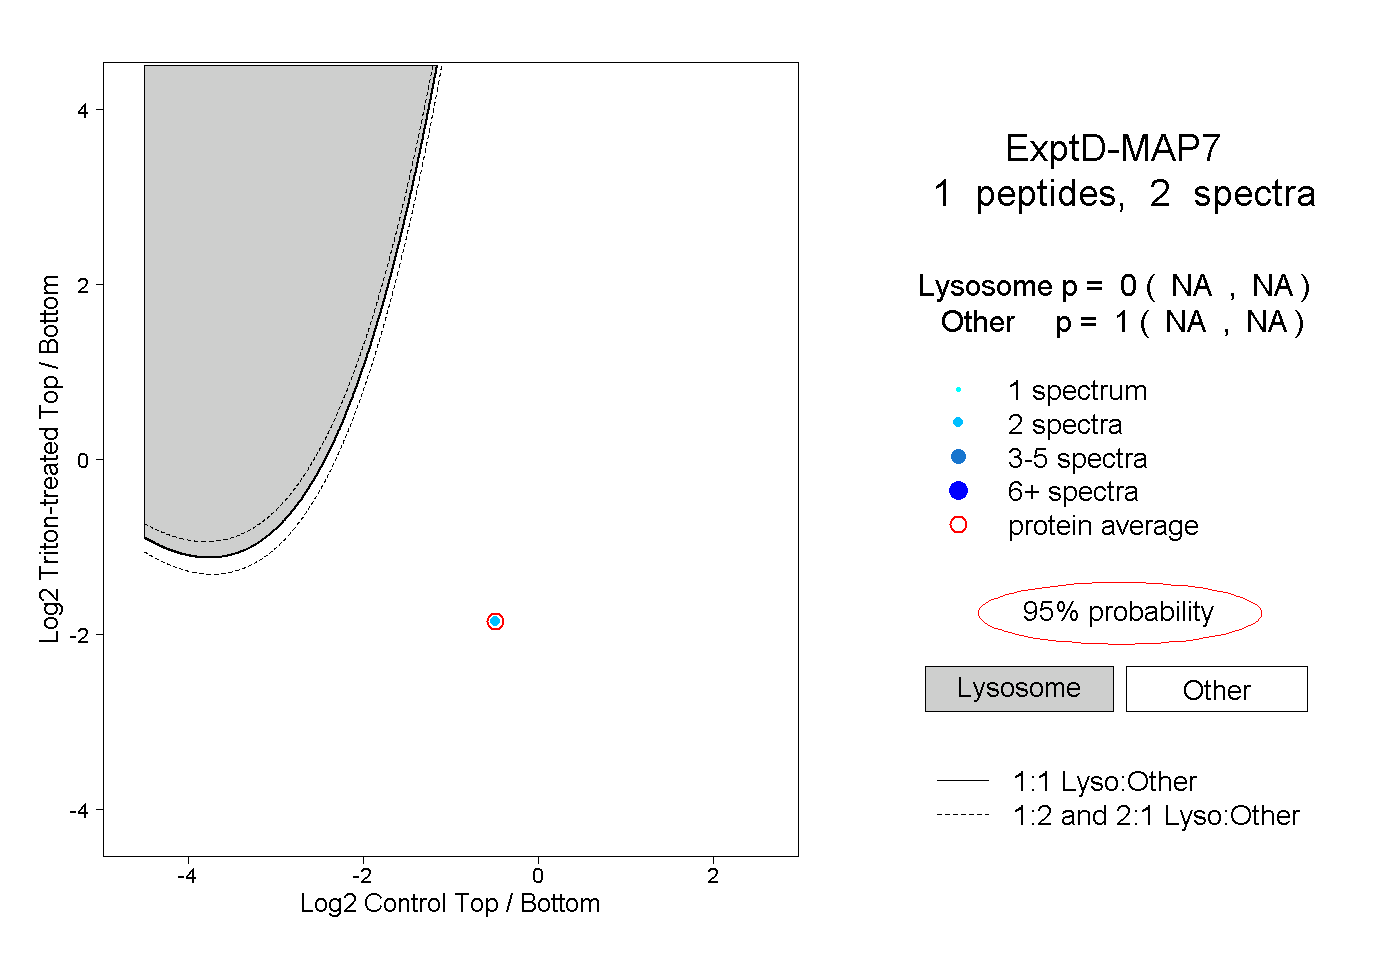 |
0.000 NA | NA |
1.000 NA | NA |