 6
6peptides
spectra
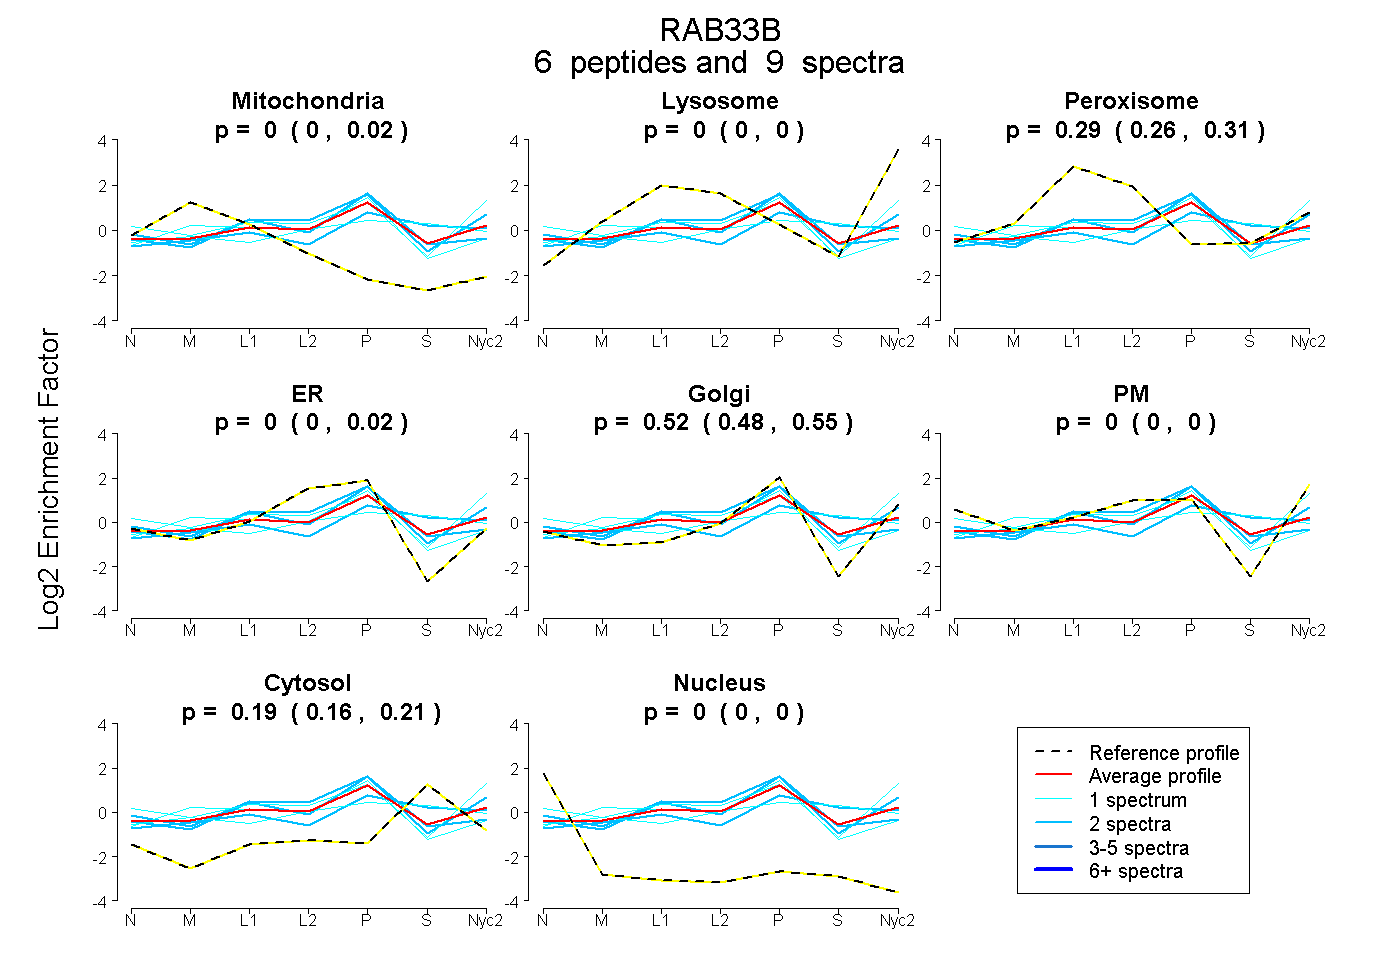
0.000 | 0.019
0.000 | 0.000
0.261 | 0.307
0.000 | 0.024
0.480 | 0.549
0.000 | 0.000
0.160 | 0.207
0.000 | 0.000
2peptides
spectra
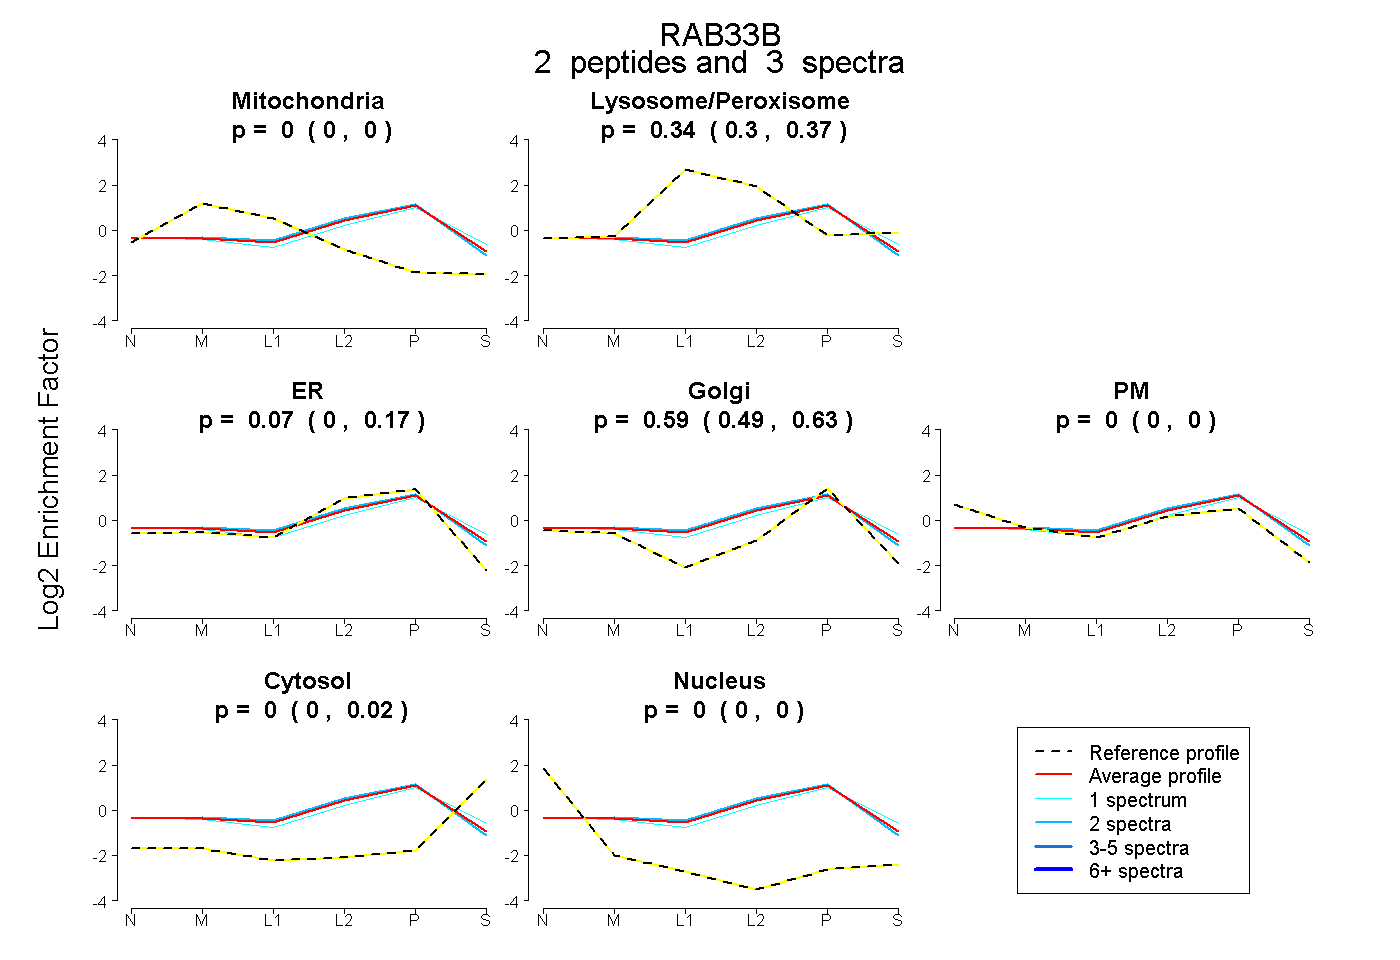
0.000 | 0.000
0.298 | 0.369
0.000 | 0.175
0.491 | 0.632
0.000 | 0.000
0.000 | 0.021
0.000 | 0.000
6peptides
spectra
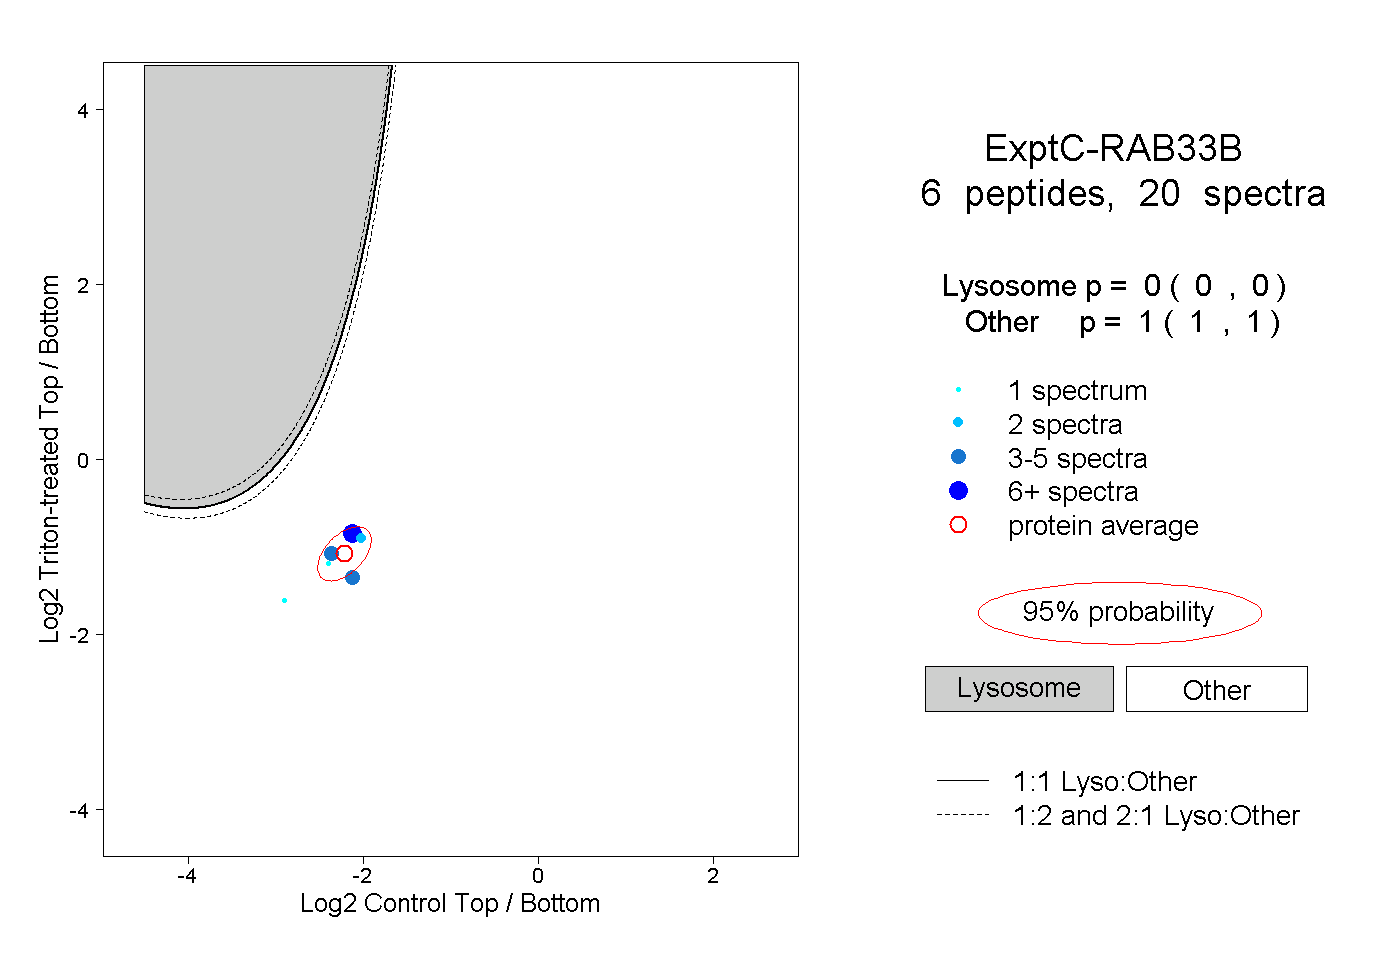
0.000 | 0.000
1.000 | 1.000
2peptides
spectra
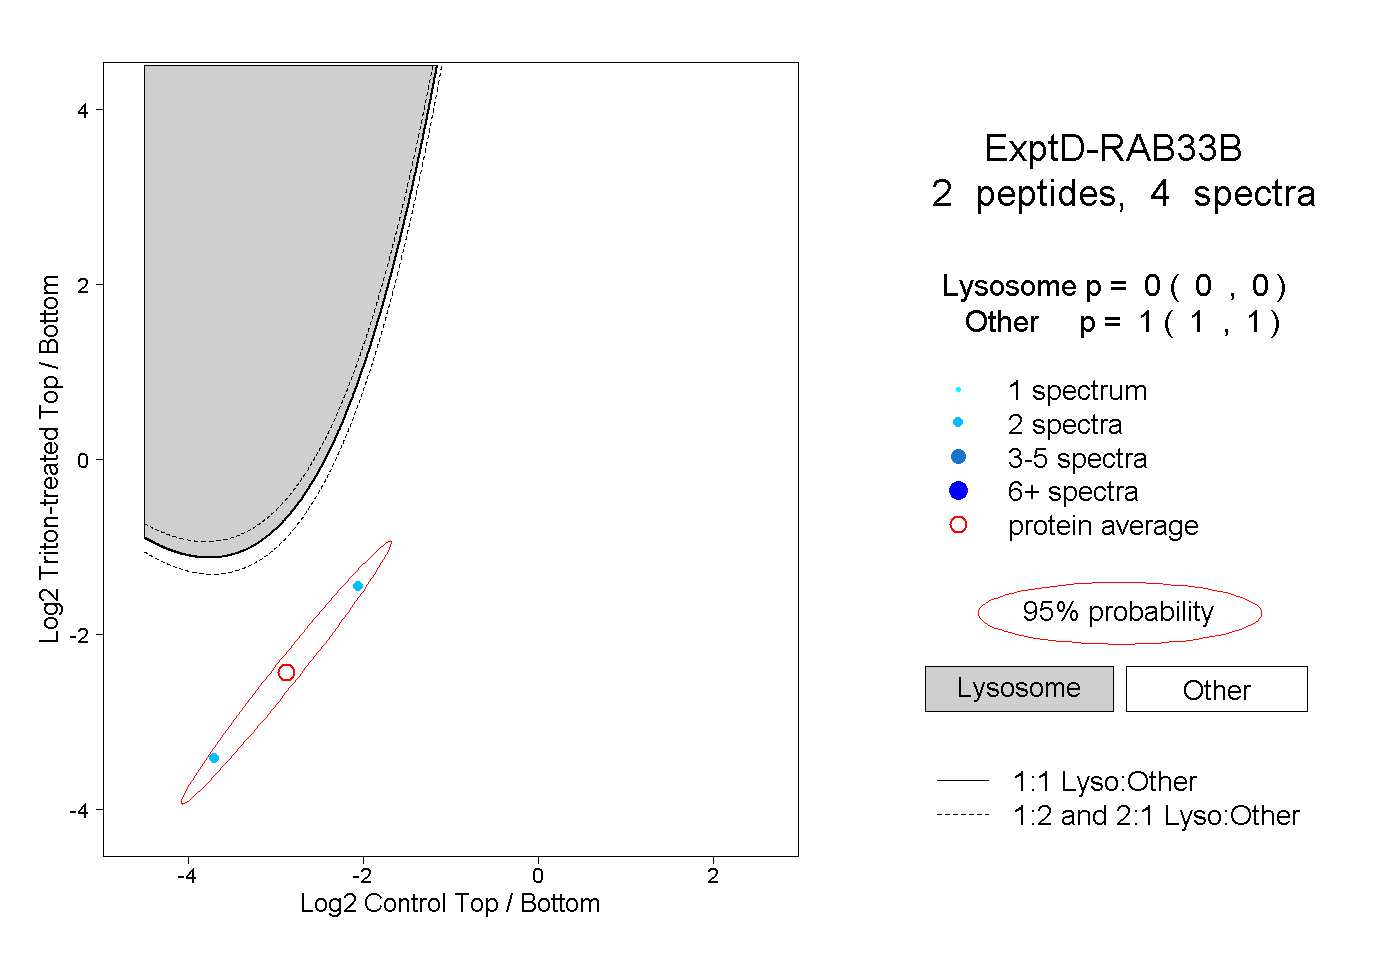
0.000 | 0.000
1.000 | 1.000