 2
2peptides
spectra
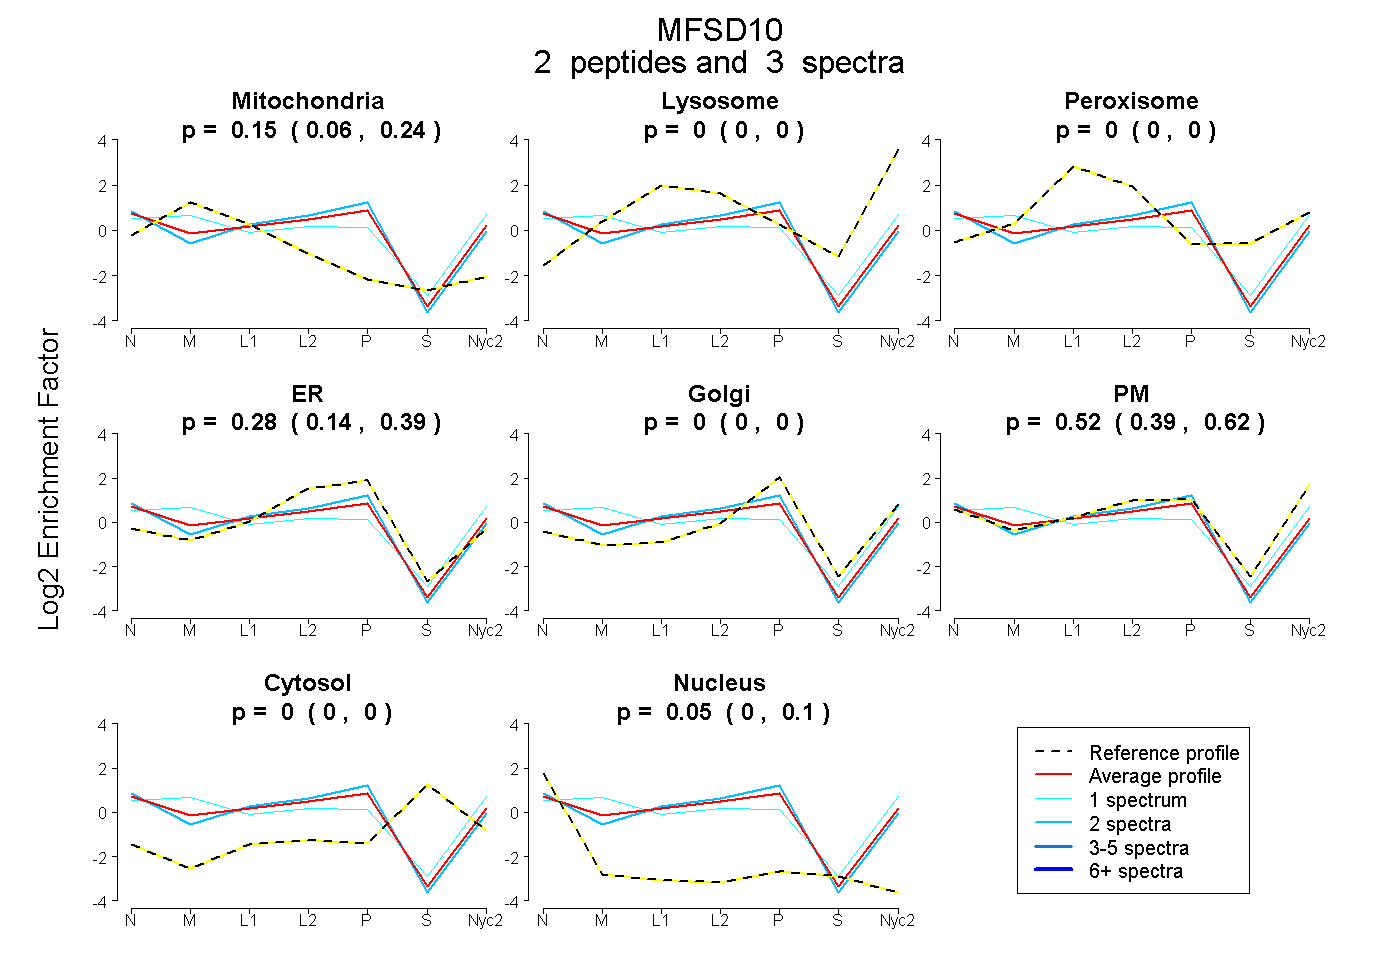
0.056 | 0.238
0.000 | 0.000
0.000 | 0.000
0.137 | 0.390
0.000 | 0.000
0.392 | 0.622
0.000 | 0.000
0.000 | 0.096
1peptide
spectrum
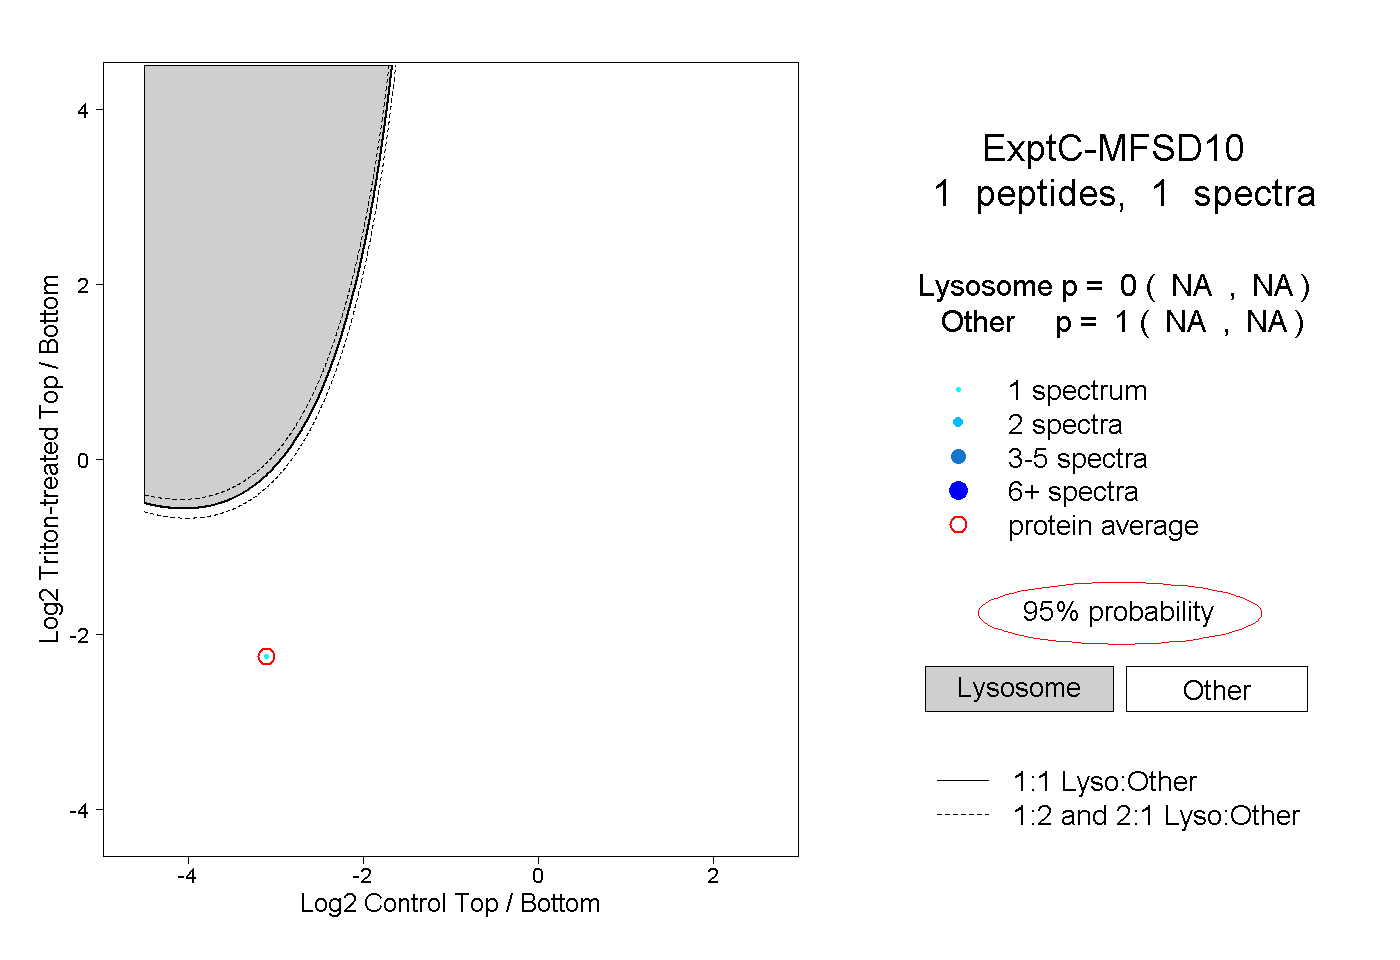
NA | NA
NA | NA
| Plot | Mito | Lyso | Perox | ER | Golgi | PM | Cytosol | Nucleus | |||||
| Expt A |
2 peptides |
3 spectra |
|
0.151 0.056 | 0.238 |
0.000 0.000 | 0.000 |
0.000 0.000 | 0.000 |
0.279 0.137 | 0.390 |
0.000 0.000 | 0.000 |
0.516 0.392 | 0.622 |
0.000 0.000 | 0.000 |
0.053 0.000 | 0.096 |
||
| Plot | Lyso | Other | |||||||||||
| Expt C |
1 peptide |
1 spectrum |
|
0.000 NA | NA |
1.000 NA | NA |