 4
4peptides
spectra
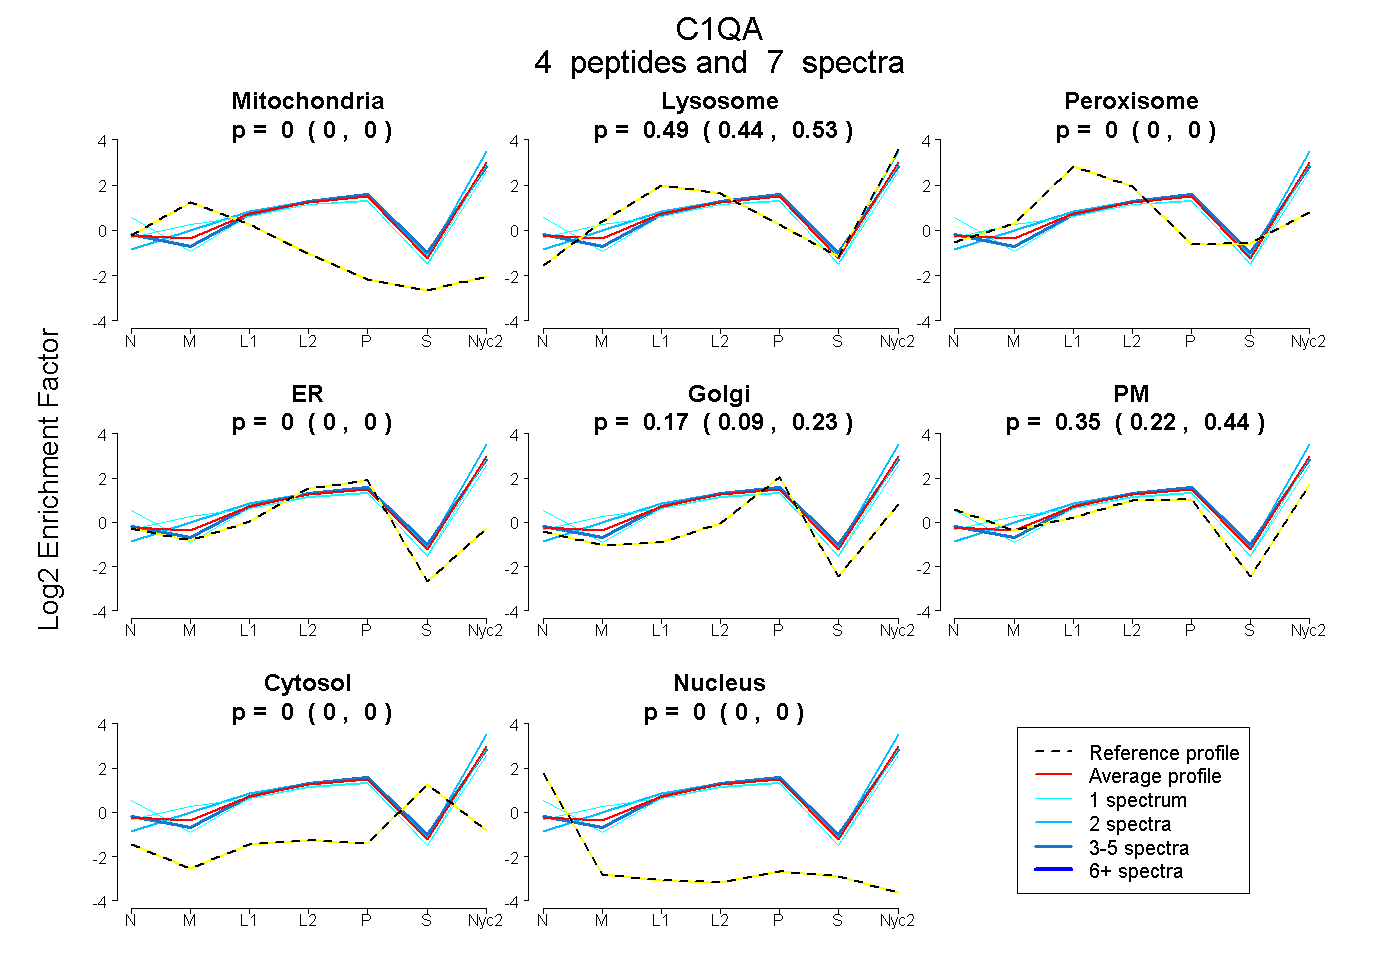
0.000 | 0.000
0.440 | 0.532
0.000 | 0.000
0.000 | 0.000
0.093 | 0.229
0.224 | 0.440
0.000 | 0.000
0.000 | 0.000
1peptide
spectra
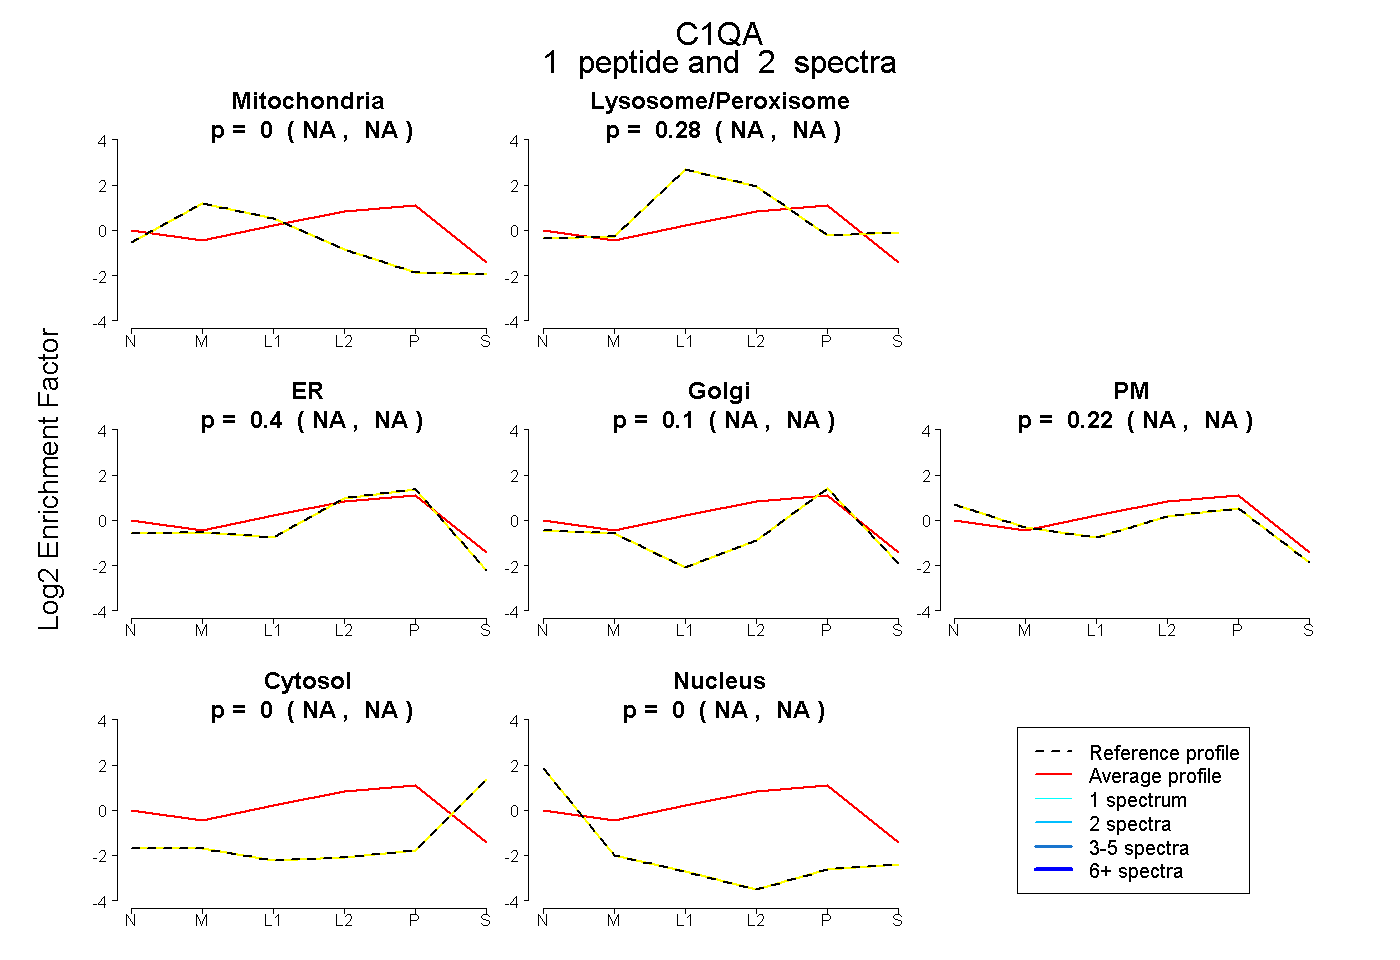
NA | NA
NA | NA
NA | NA
NA | NA
NA | NA
NA | NA
NA | NA
5peptides
spectra
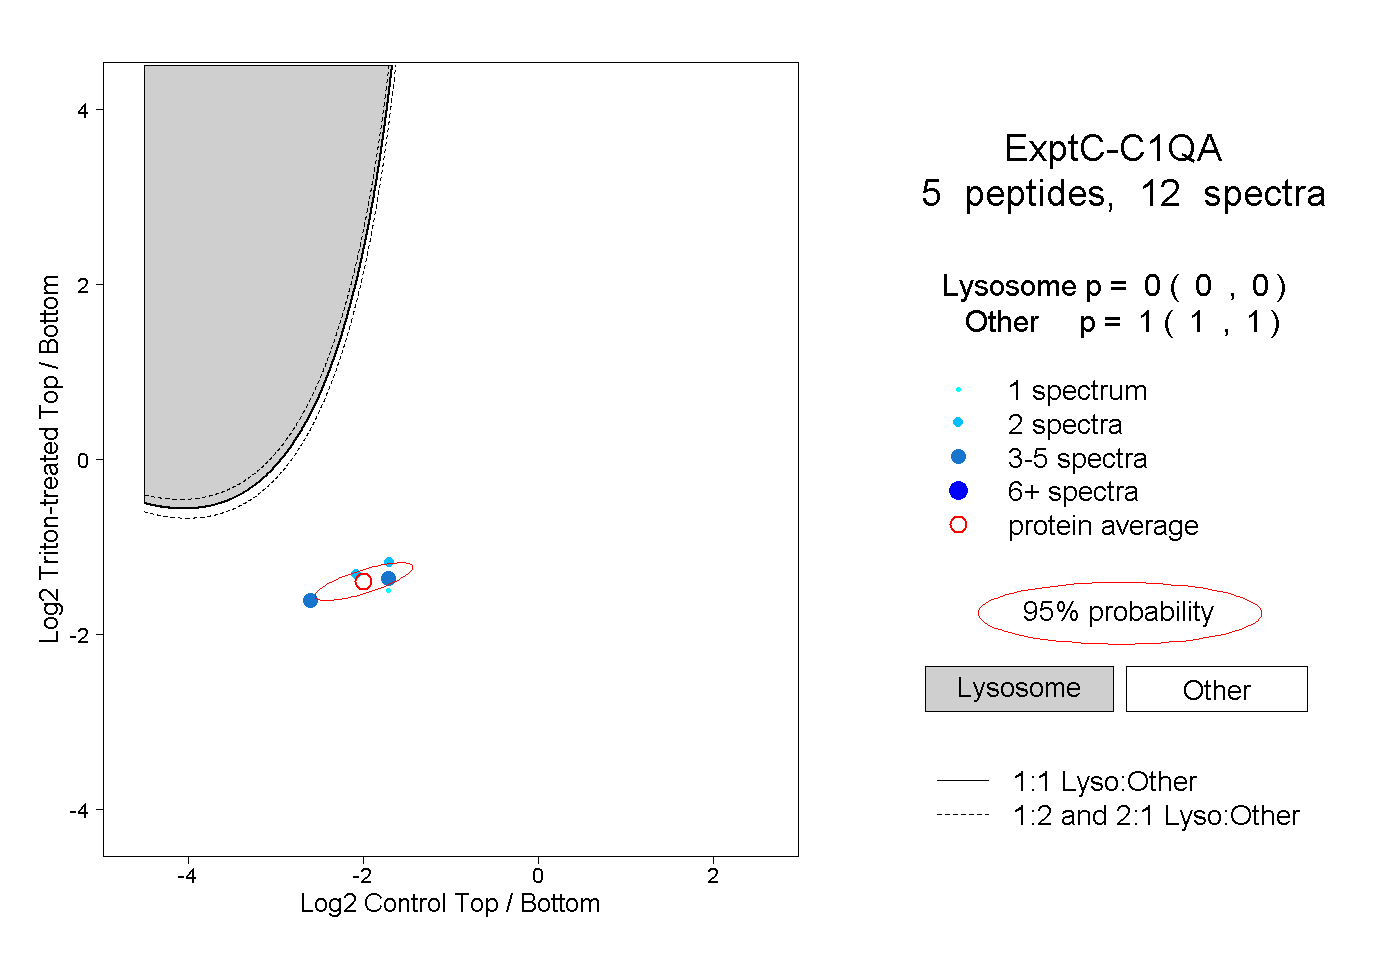
0.000 | 0.000
1.000 | 1.000
2peptides
spectra
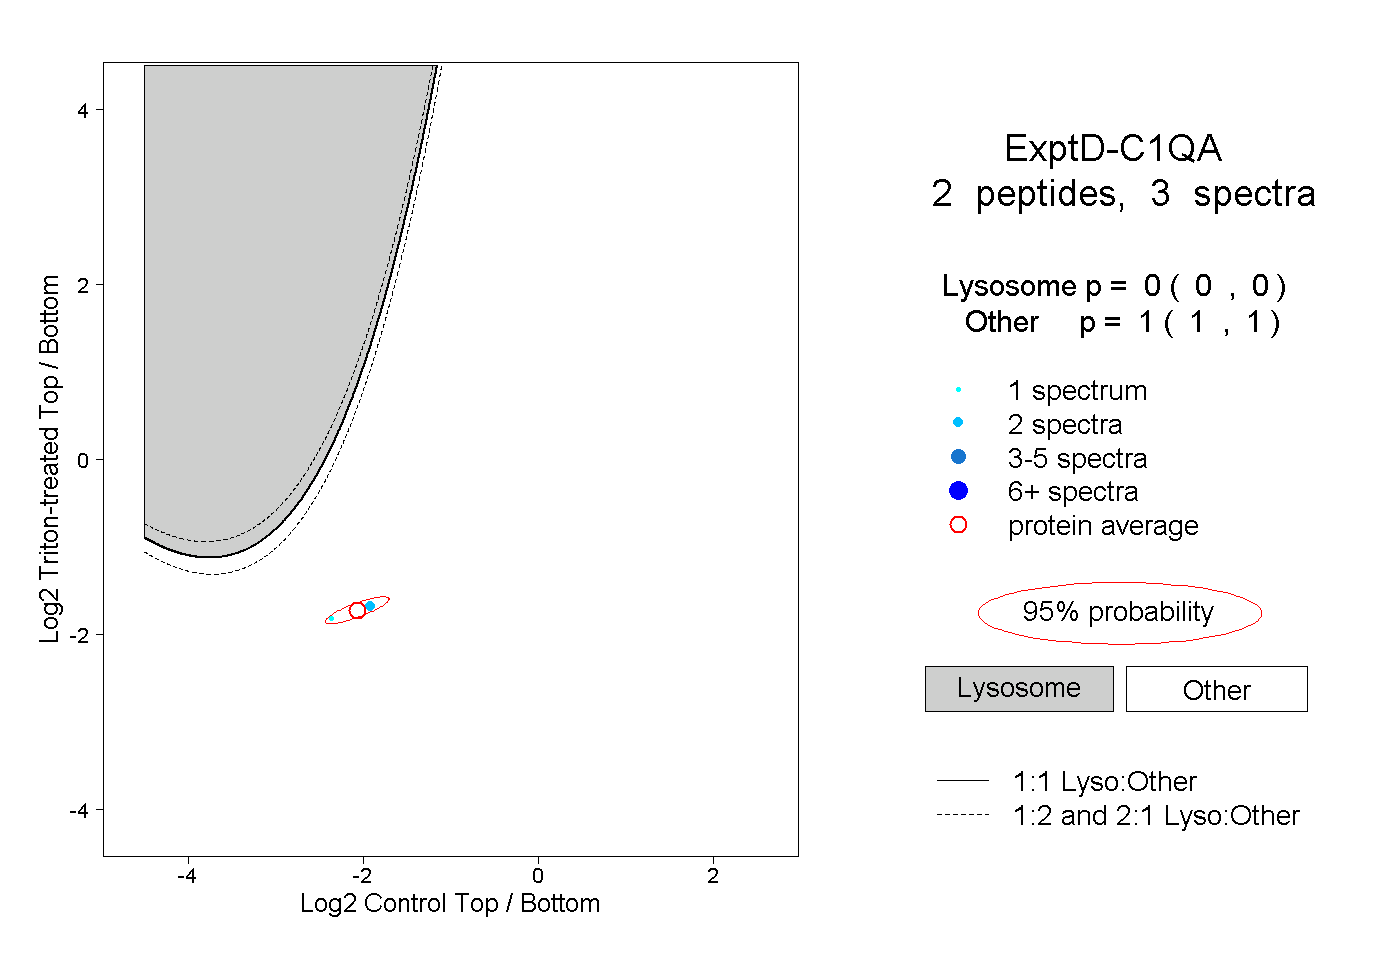
0.000 | 0.000
1.000 | 1.000