 1
1peptide
spectra
NA | NA
NA | NA
NA | NA
NA | NA
NA | NA
NA | NA
NA | NA
NA | NA
5peptides
spectra
0.000 | 1.000
0.000 | 1.000
| Plot | Mito | Lyso | Perox | ER | Golgi | PM | Cytosol | Nucleus | |||||
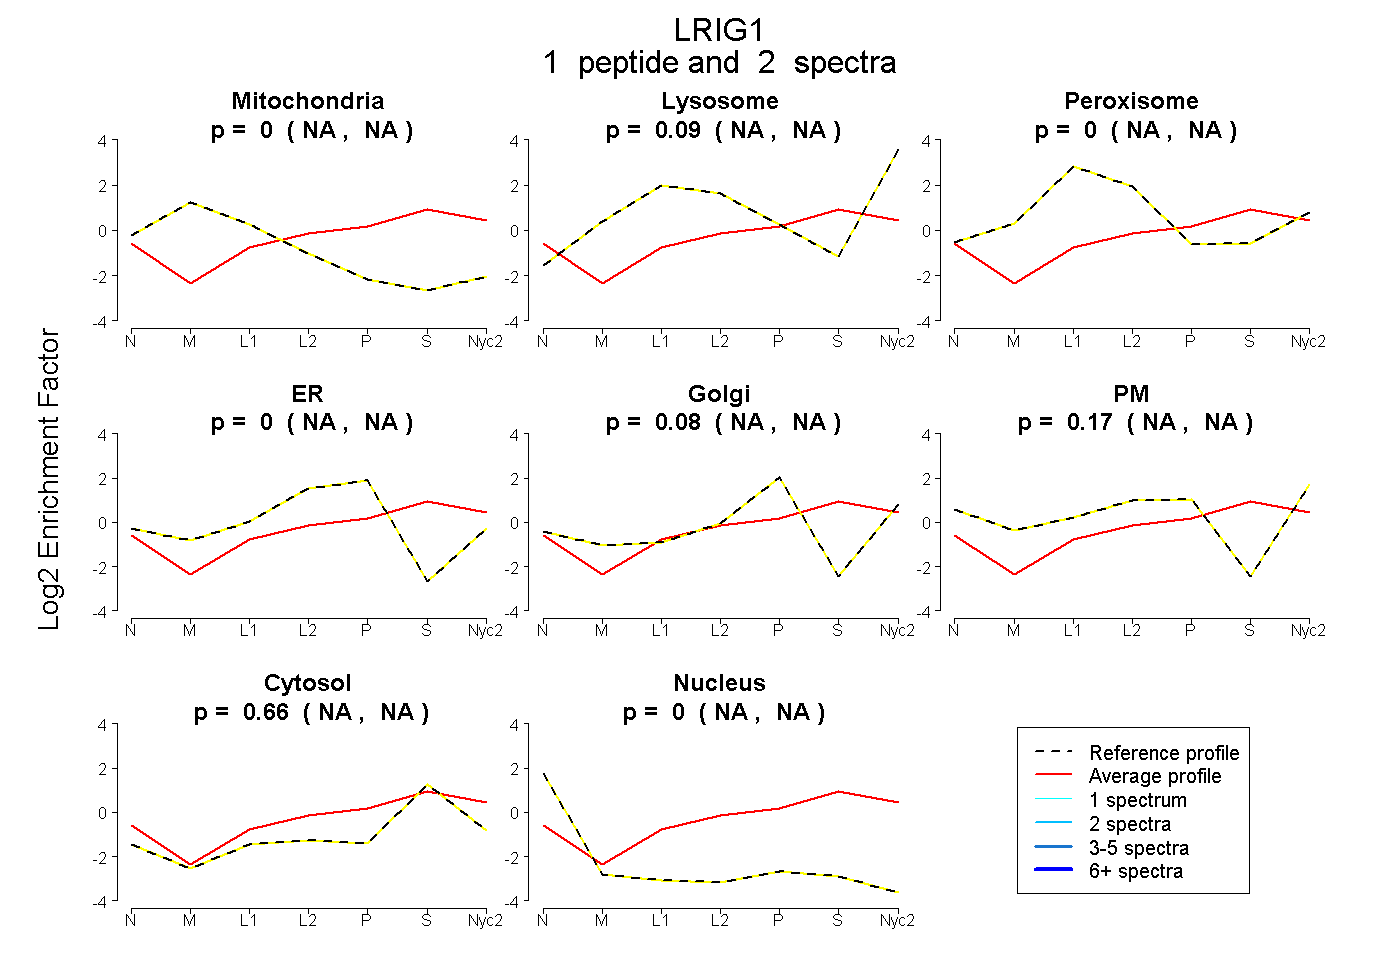
| Expt A |
1 peptide |
2 spectra |
|
0.000 NA | NA |
0.090 NA | NA |
0.000 NA | NA |
0.000 NA | NA |
0.076 NA | NA |
0.175 NA | NA |
0.659 NA | NA |
0.000 NA | NA |
||
| Plot | Lyso | Other | |||||||||||
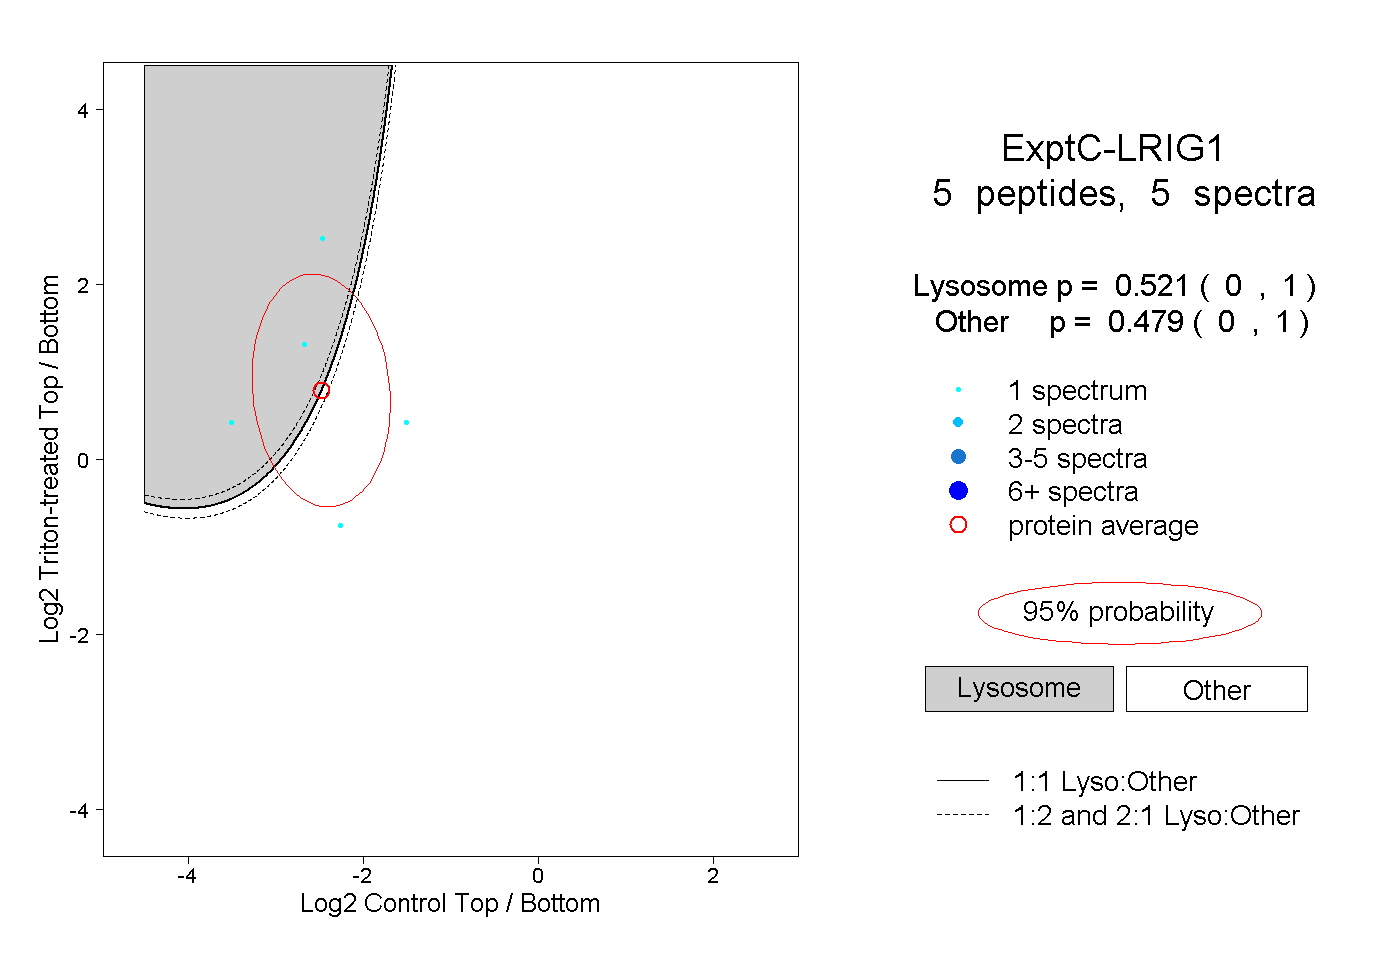
| Expt C |
5 peptides |
5 spectra |
|
0.521 0.000 | 1.000 |
0.479 0.000 | 1.000 |