 6
6peptides
spectra
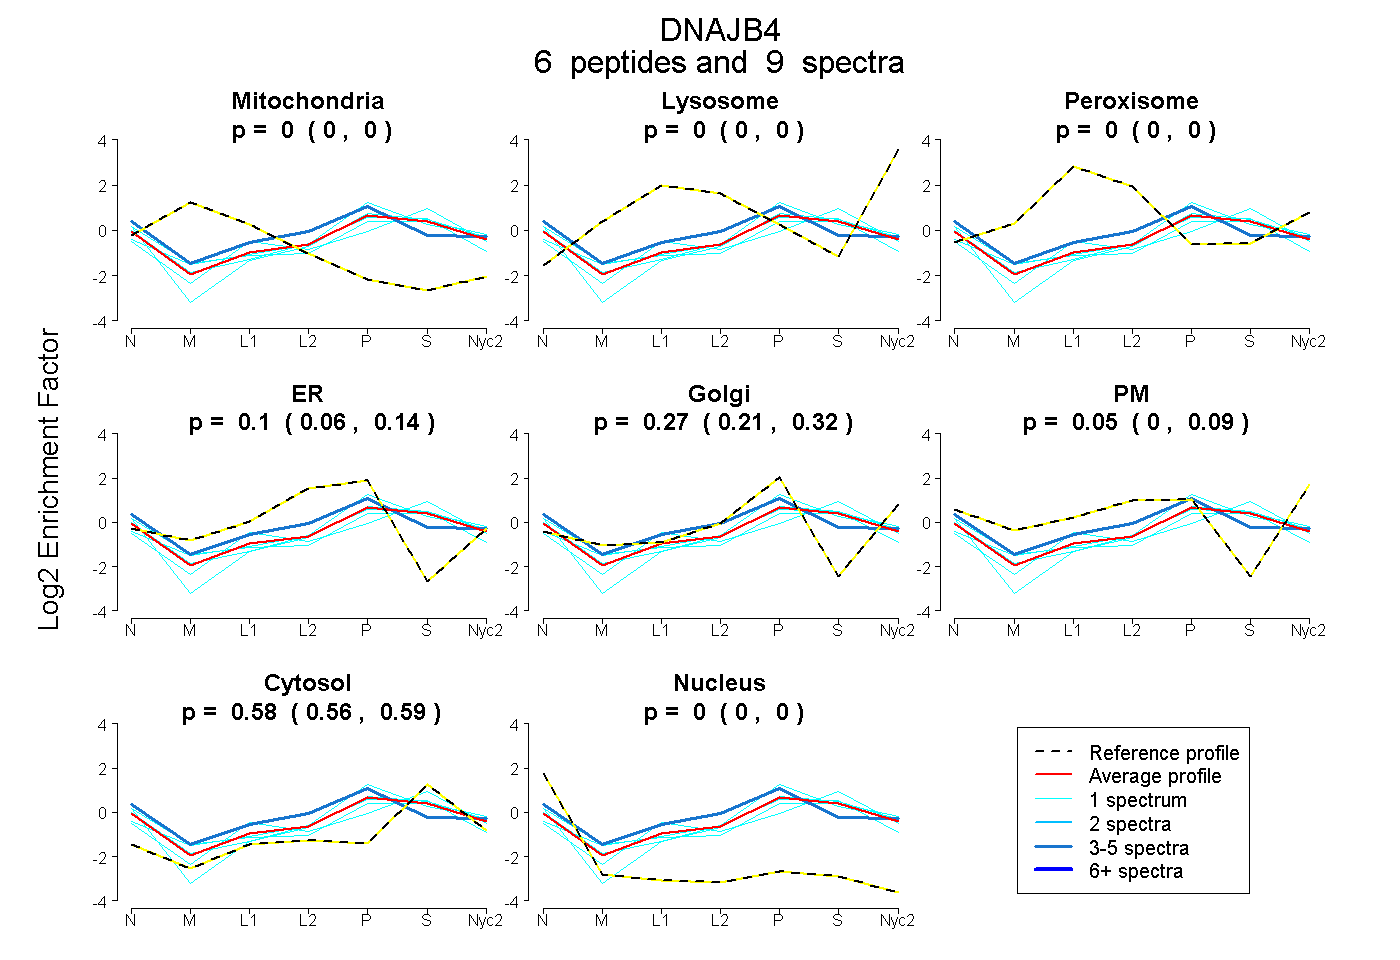
0.000 | 0.000
0.000 | 0.000
0.000 | 0.000
0.063 | 0.136
0.212 | 0.324
0.000 | 0.088
0.556 | 0.594
0.000 | 0.004
| Plot | Mito | Lyso | Perox | ER | Golgi | PM | Cytosol | Nucleus | |||||
| Expt A |
6 peptides |
9 spectra |
|
0.000 0.000 | 0.000 |
0.000 0.000 | 0.000 |
0.000 0.000 | 0.000 |
0.104 0.063 | 0.136 |
0.273 0.212 | 0.324 |
0.046 0.000 | 0.088 |
0.577 0.556 | 0.594 |
0.000 0.000 | 0.004 |
| 1 spectrum, GATDEDIK | 0.000 | 0.000 | 0.000 | 0.049 | 0.470 | 0.000 | 0.482 | 0.000 | ||
| 1 spectrum, EIYDQFGEEGLK | 0.000 | 0.000 | 0.000 | 0.000 | 0.233 | 0.175 | 0.564 | 0.028 | ||
| 4 spectra, NSVGPSR | 0.000 | 0.000 | 0.000 | 0.285 | 0.109 | 0.192 | 0.412 | 0.002 | ||
| 1 spectrum, EVAEAYEVLSDPK | 0.000 | 0.000 | 0.102 | 0.027 | 0.159 | 0.000 | 0.712 | 0.000 | ||
| 1 spectrum, LNPDGR | 0.000 | 0.000 | 0.000 | 0.214 | 0.153 | 0.000 | 0.597 | 0.035 | ||
| 1 spectrum, GGAGGTDGQGGTFR | 0.000 | 0.000 | 0.000 | 0.000 | 0.369 | 0.000 | 0.613 | 0.018 |
| Plot | Lyso | Other | |||||||||||
| Expt C |
1 peptide |
1 spectrum |
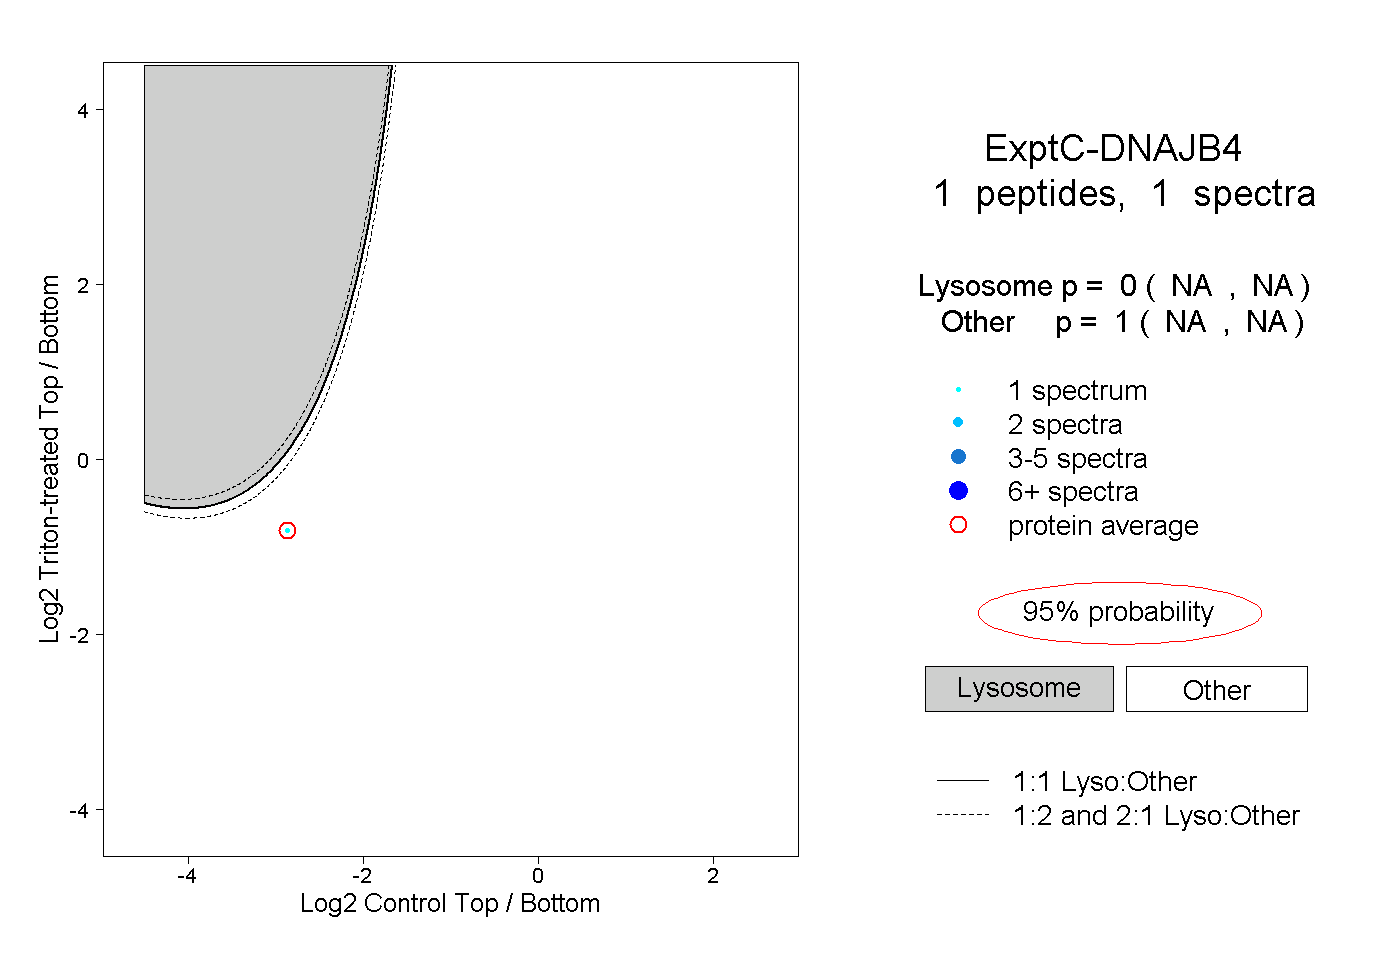 |
0.000 NA | NA |
1.000 NA | NA |