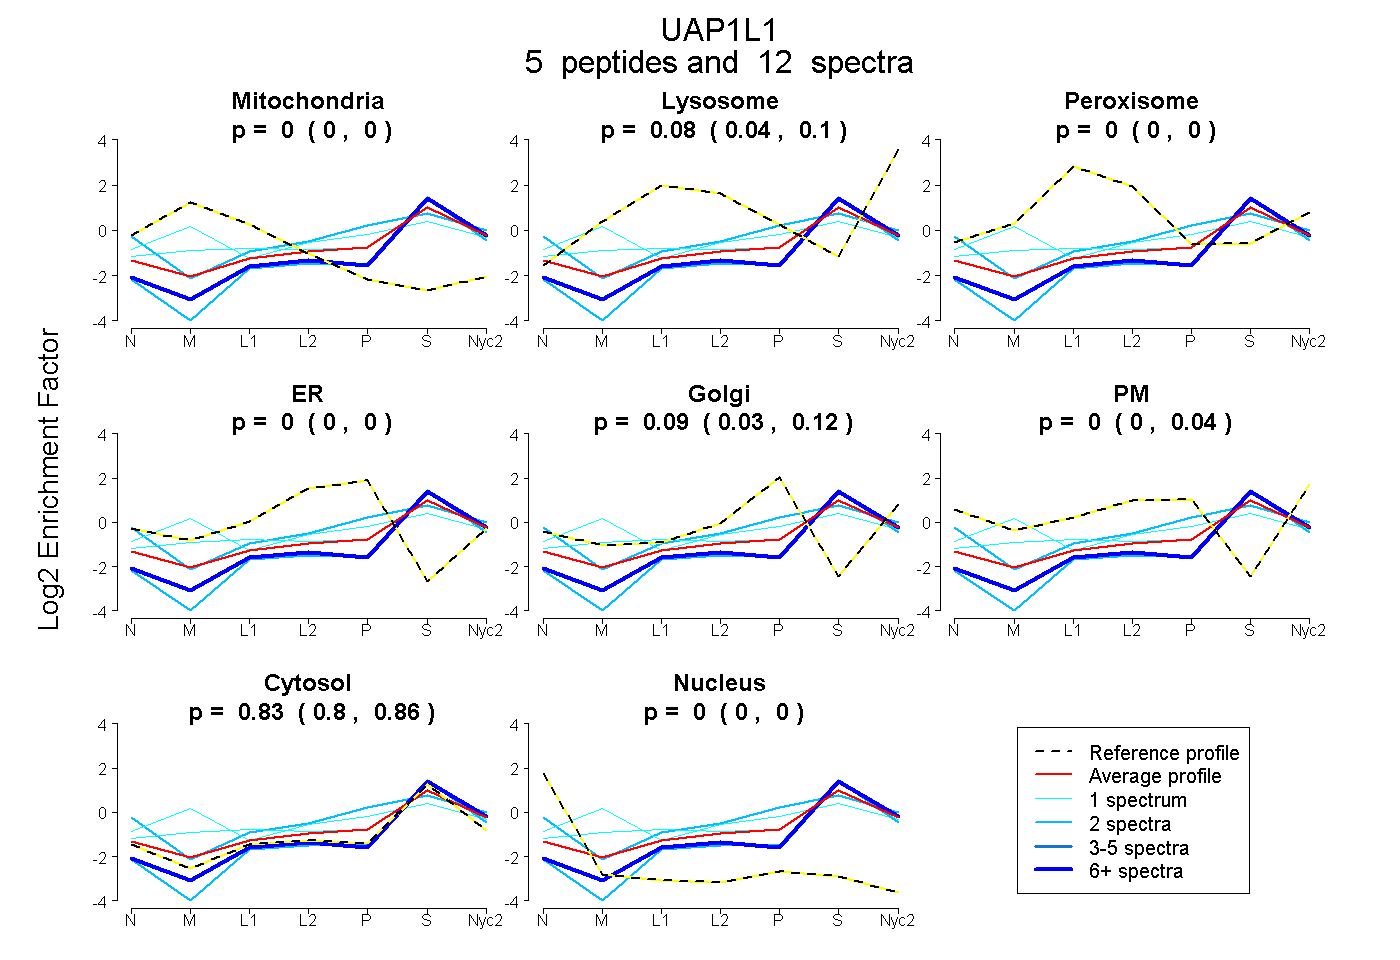
 5
5peptides
spectra
0.000 | 0.002
0.043 | 0.104
0.000 | 0.000
0.000 | 0.000
0.030 | 0.117
0.000 | 0.043
0.802 | 0.864
0.000 | 0.000
| Plot | Mito | Lyso | Perox | ER | Golgi | PM | Cytosol | Nucleus | |||||
| Expt A |
5 peptides |
12 spectra |
|
0.000 0.000 | 0.002 |
0.081 0.043 | 0.104 |
0.000 0.000 | 0.000 |
0.000 0.000 | 0.000 |
0.085 0.030 | 0.117 |
0.000 0.000 | 0.043 |
0.834 0.802 | 0.864 |
0.000 0.000 | 0.000 |
| 2 spectra, GFLDMVIR | 0.000 | 0.000 | 0.000 | 0.000 | 0.000 | 0.000 | 1.000 | 0.000 | ||
| 1 spectrum, EEEFSPLK | 0.101 | 0.138 | 0.043 | 0.000 | 0.008 | 0.000 | 0.710 | 0.000 | ||
| 2 spectra, ALLVQHYR | 0.000 | 0.000 | 0.000 | 0.000 | 0.109 | 0.231 | 0.660 | 0.000 | ||
| 6 spectra, WEEEGFR | 0.000 | 0.000 | 0.000 | 0.000 | 0.000 | 0.000 | 1.000 | 0.000 | ||
| 1 spectrum, EHDFFHLDPANVVLFEQR | 0.204 | 0.121 | 0.000 | 0.000 | 0.189 | 0.000 | 0.486 | 0.000 |
| Plot | Lyso | Other | |||||||||||
| Expt C |
2 peptides |
3 spectra |
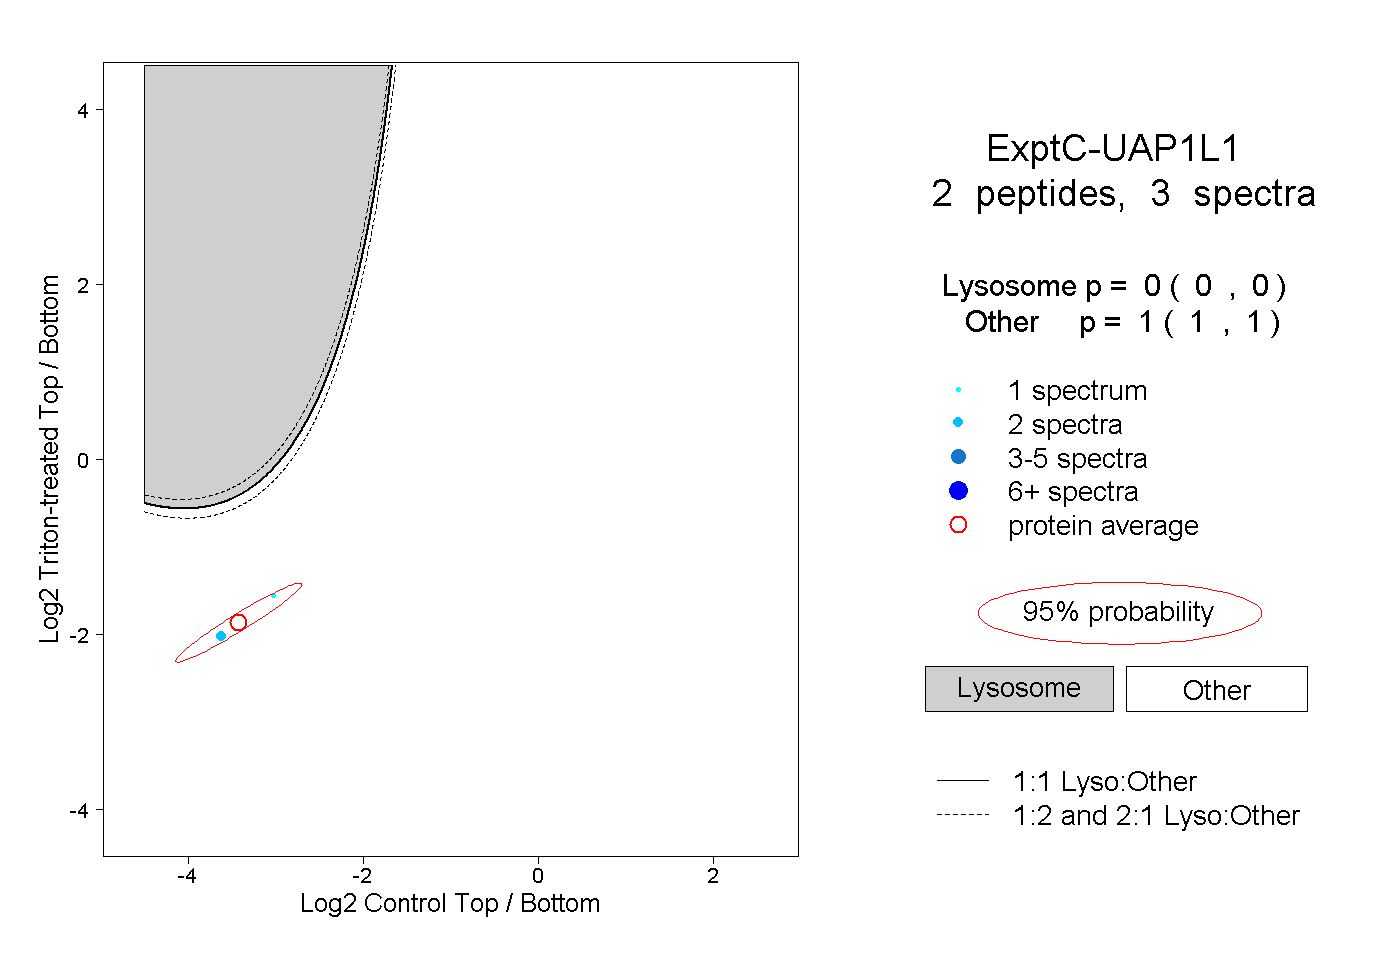 |
0.000 0.000 | 0.000 |
1.000 1.000 | 1.000 |