 4
4peptides
spectra
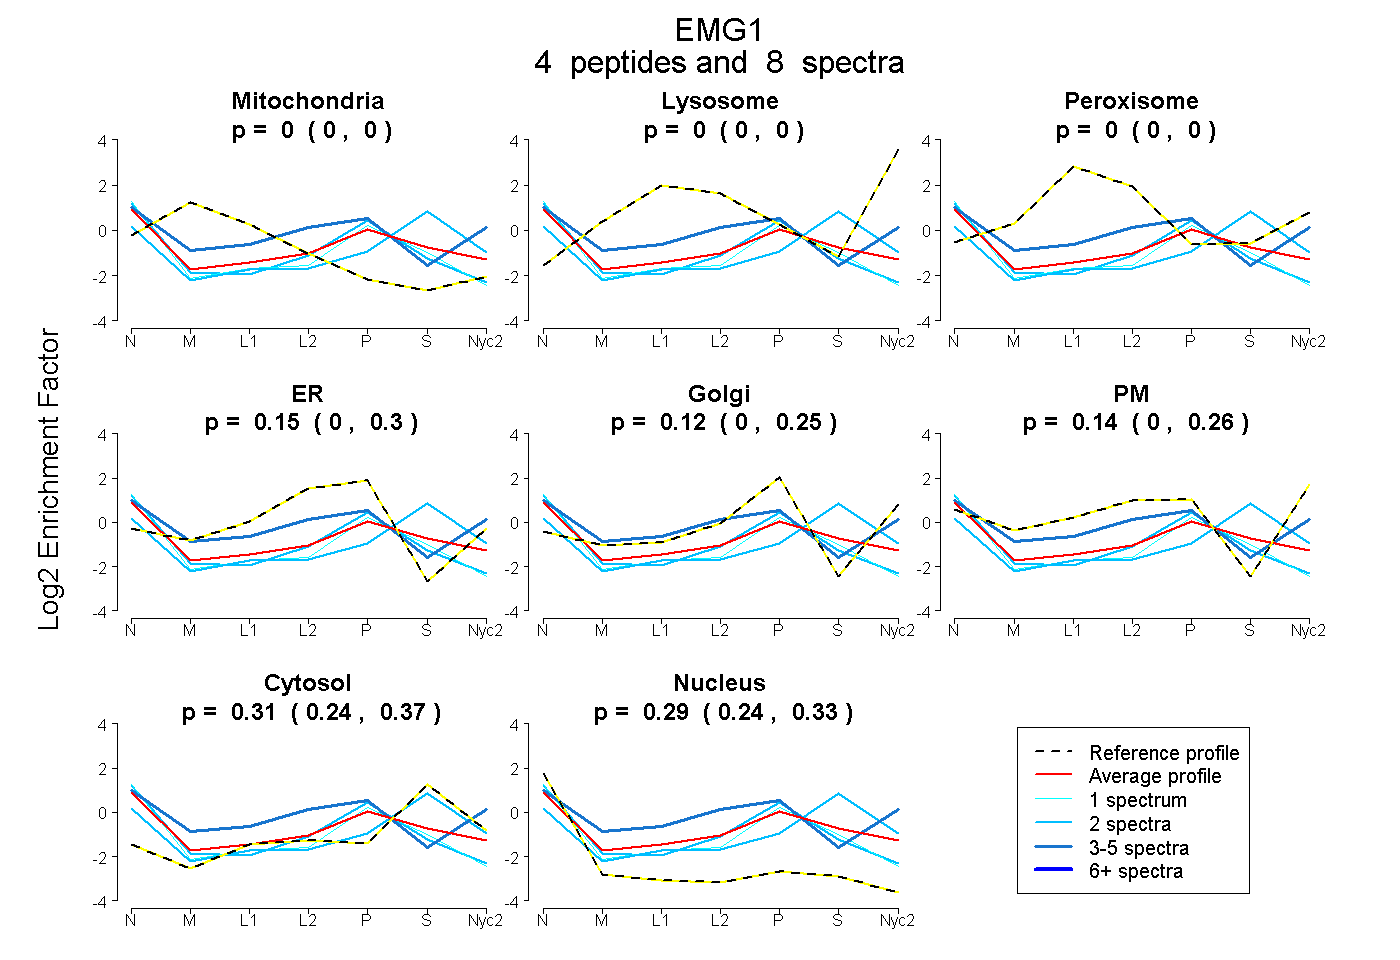
0.000 | 0.000
0.000 | 0.000
0.000 | 0.000
0.000 | 0.297
0.000 | 0.249
0.000 | 0.261
0.244 | 0.372
0.239 | 0.326
1peptide
spectra
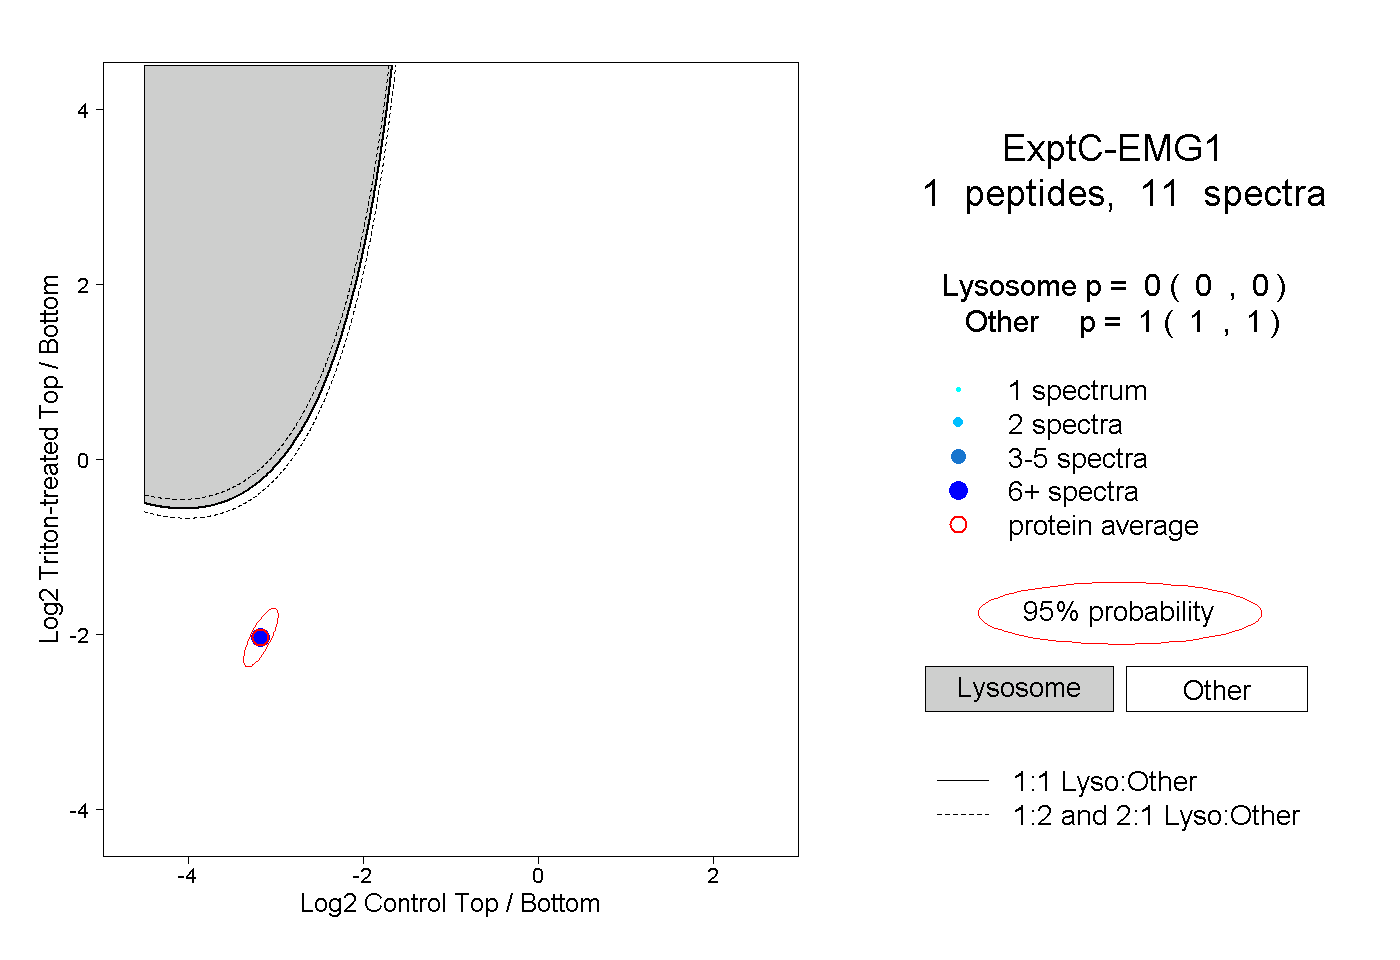
0.000 | 0.000
1.000 | 1.000
| Plot | Mito | Lyso | Perox | ER | Golgi | PM | Cytosol | Nucleus | |||||
| Expt A |
4 peptides |
8 spectra |
|
0.000 0.000 | 0.000 |
0.000 0.000 | 0.000 |
0.000 0.000 | 0.000 |
0.146 0.000 | 0.297 |
0.117 0.000 | 0.249 |
0.137 0.000 | 0.261 |
0.313 0.244 | 0.372 |
0.287 0.239 | 0.326 |
||
| Plot | Lyso | Other | |||||||||||
| Expt C |
1 peptide |
11 spectra |
|
0.000 0.000 | 0.000 |
1.000 1.000 | 1.000 |