 3
3peptides
spectra
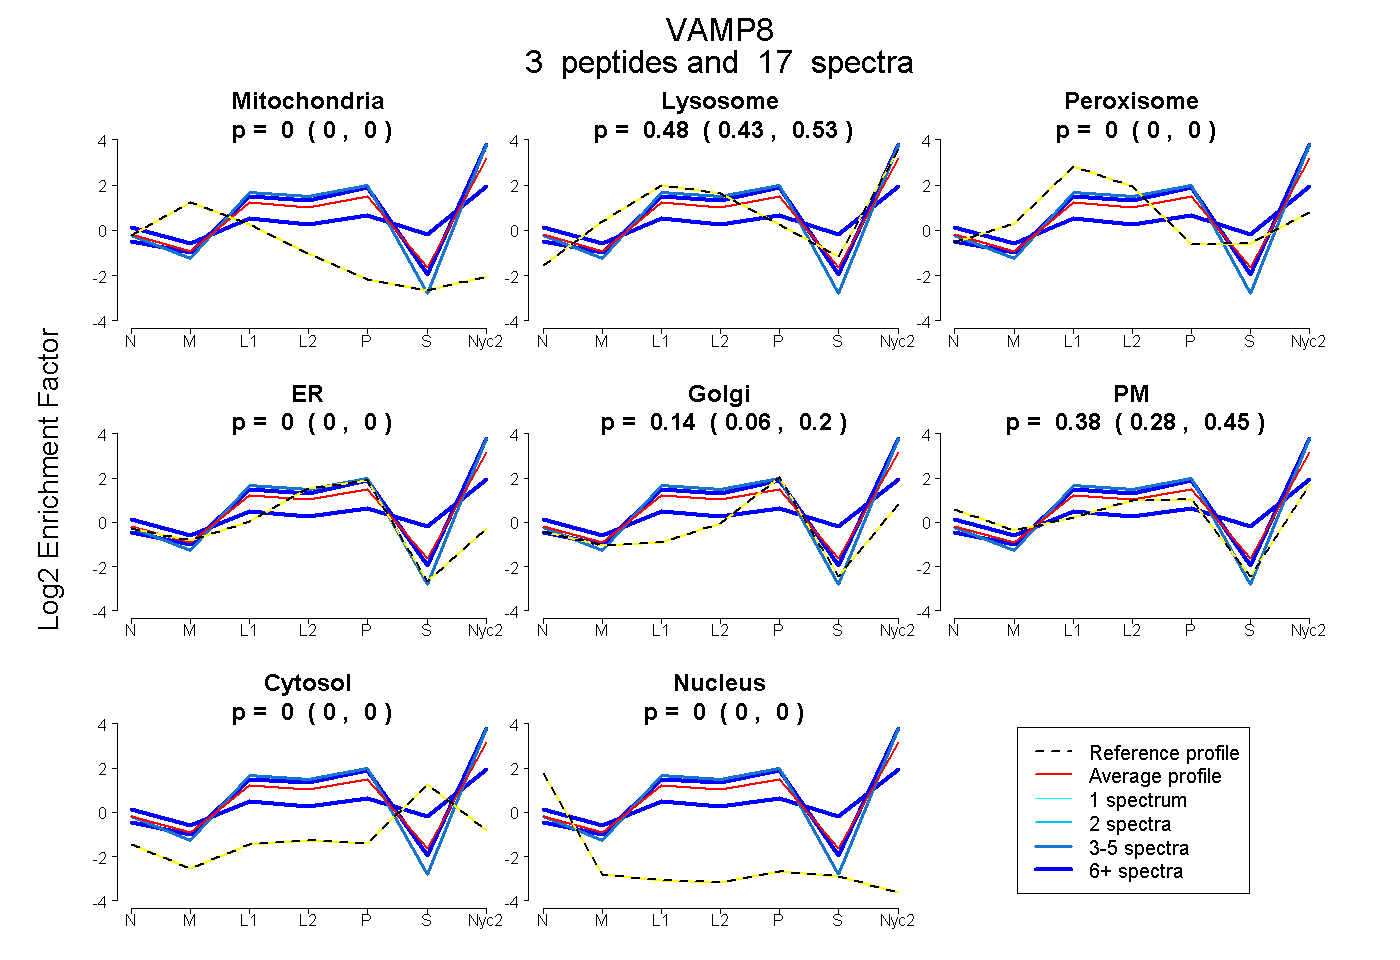
0.000 | 0.000
0.431 | 0.529
0.000 | 0.000
0.000 | 0.000
0.063 | 0.205
0.281 | 0.450
0.000 | 0.000
0.000 | 0.000
3peptides
spectra
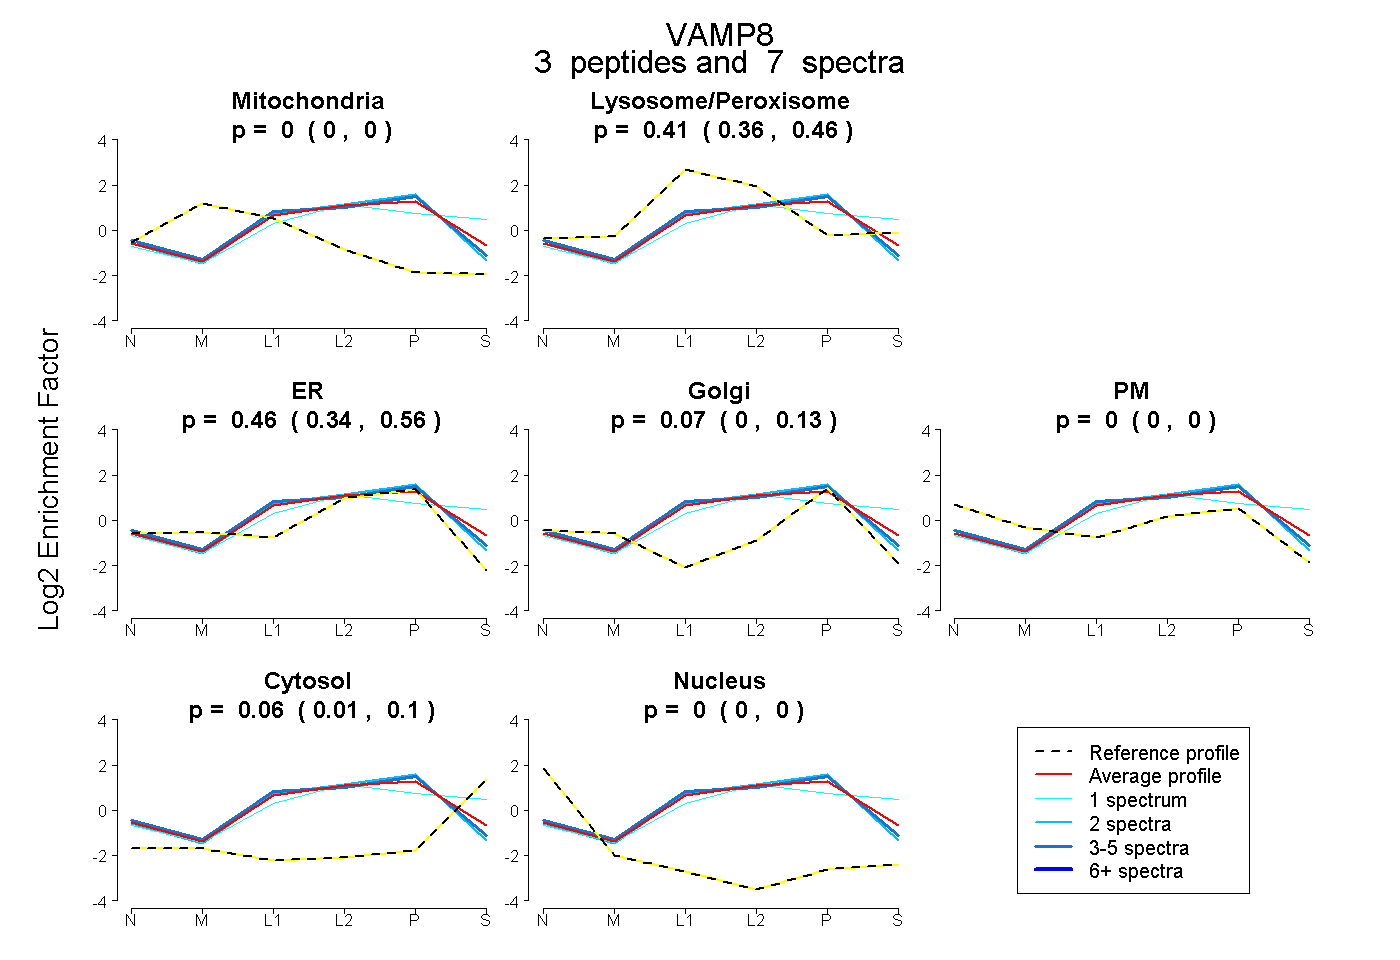
0.000 | 0.000
0.361 | 0.460
0.343 | 0.556
0.000 | 0.134
0.000 | 0.000
0.015 | 0.099
0.000 | 0.000
3peptides
spectra
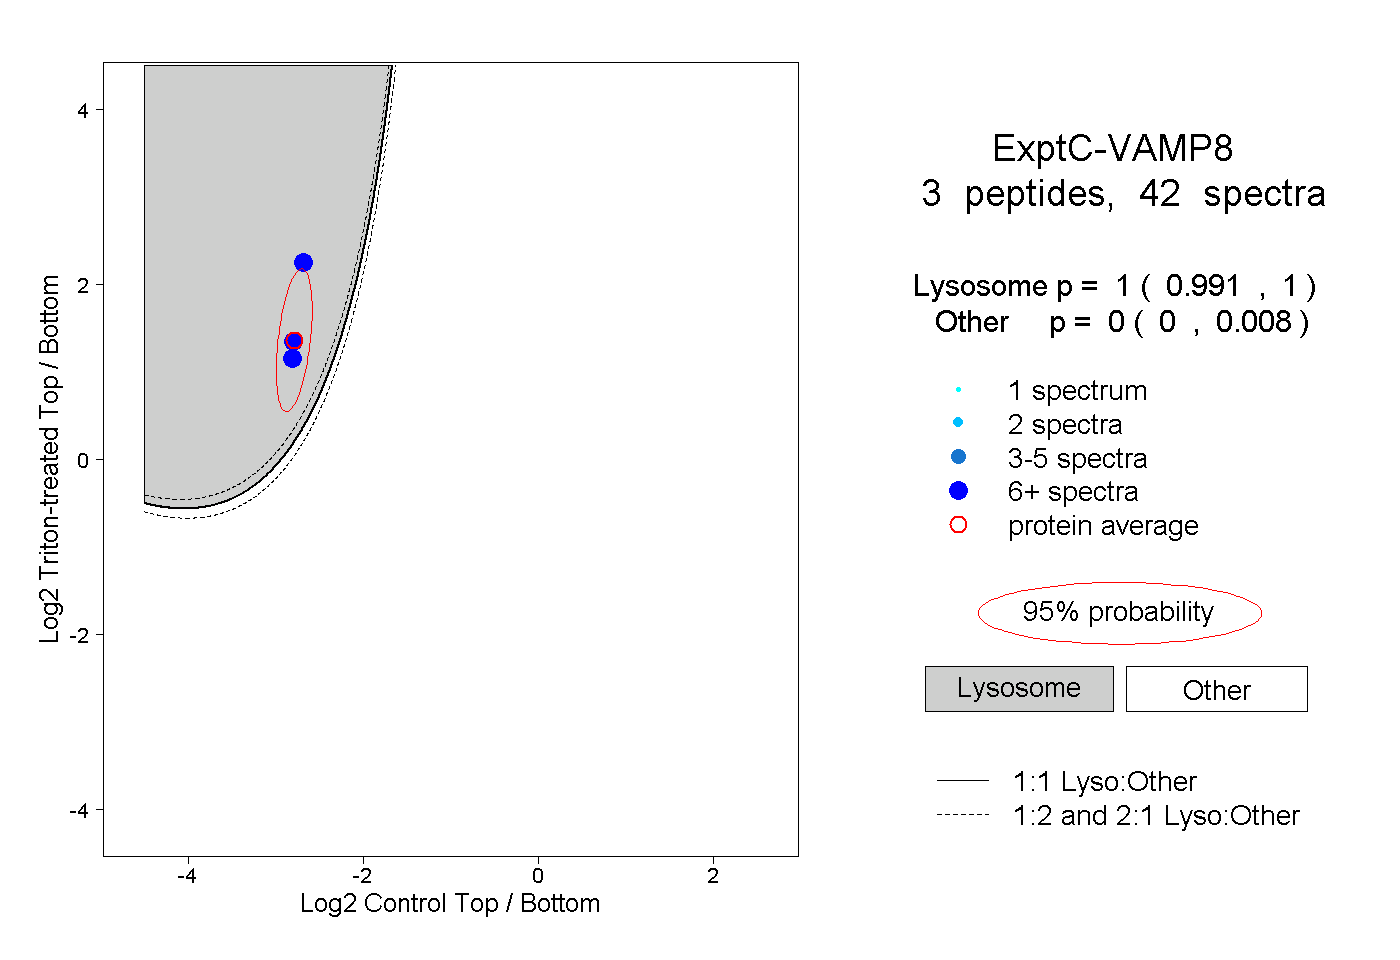
0.991 | 1.000
0.000 | 0.008
2peptides
spectra
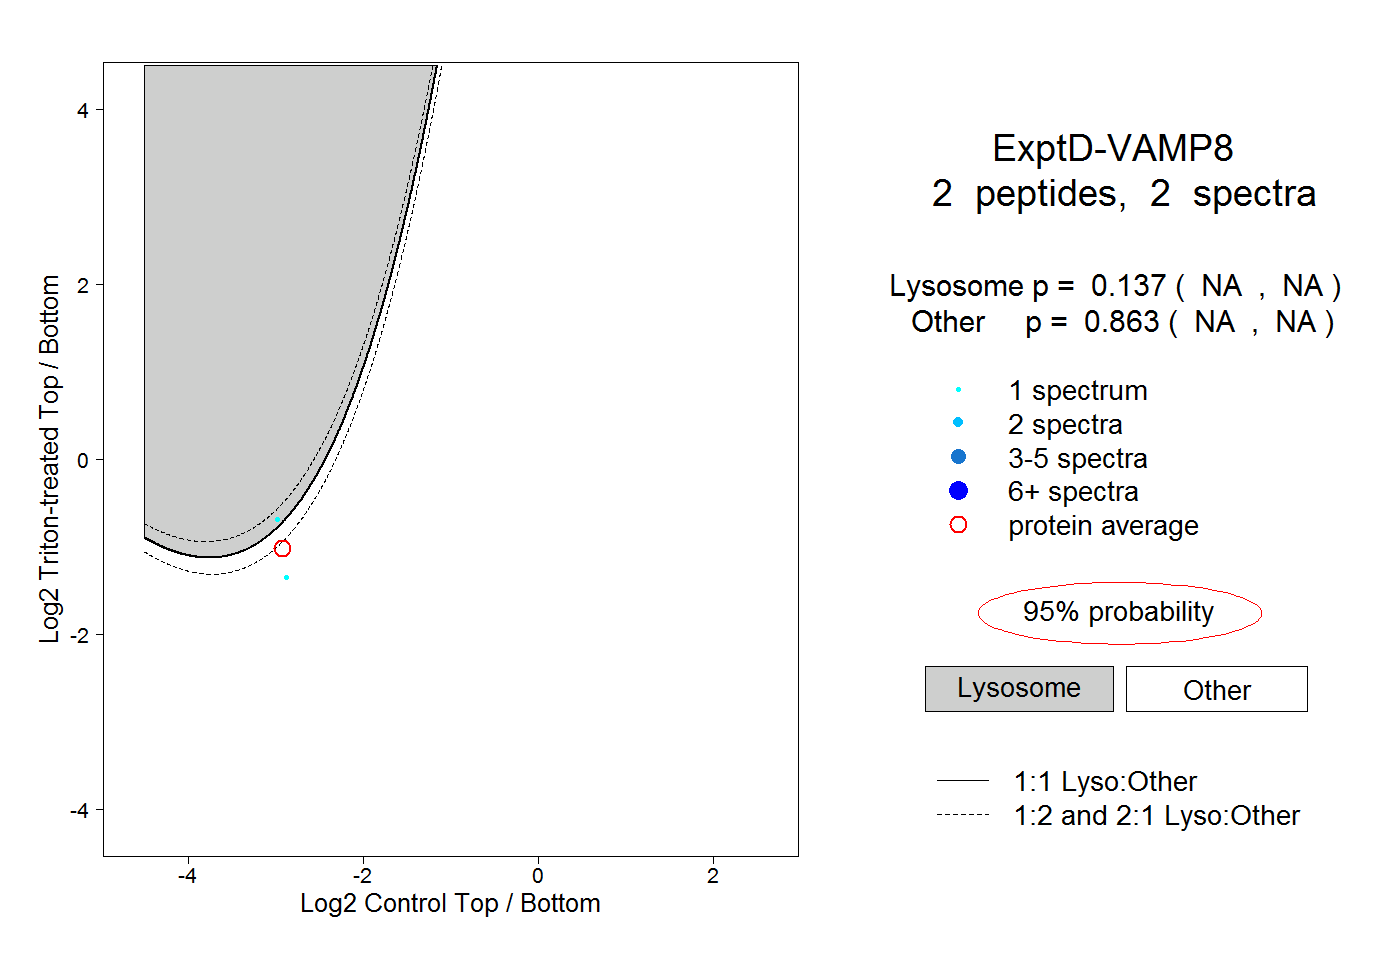
NA | NA
NA | NA