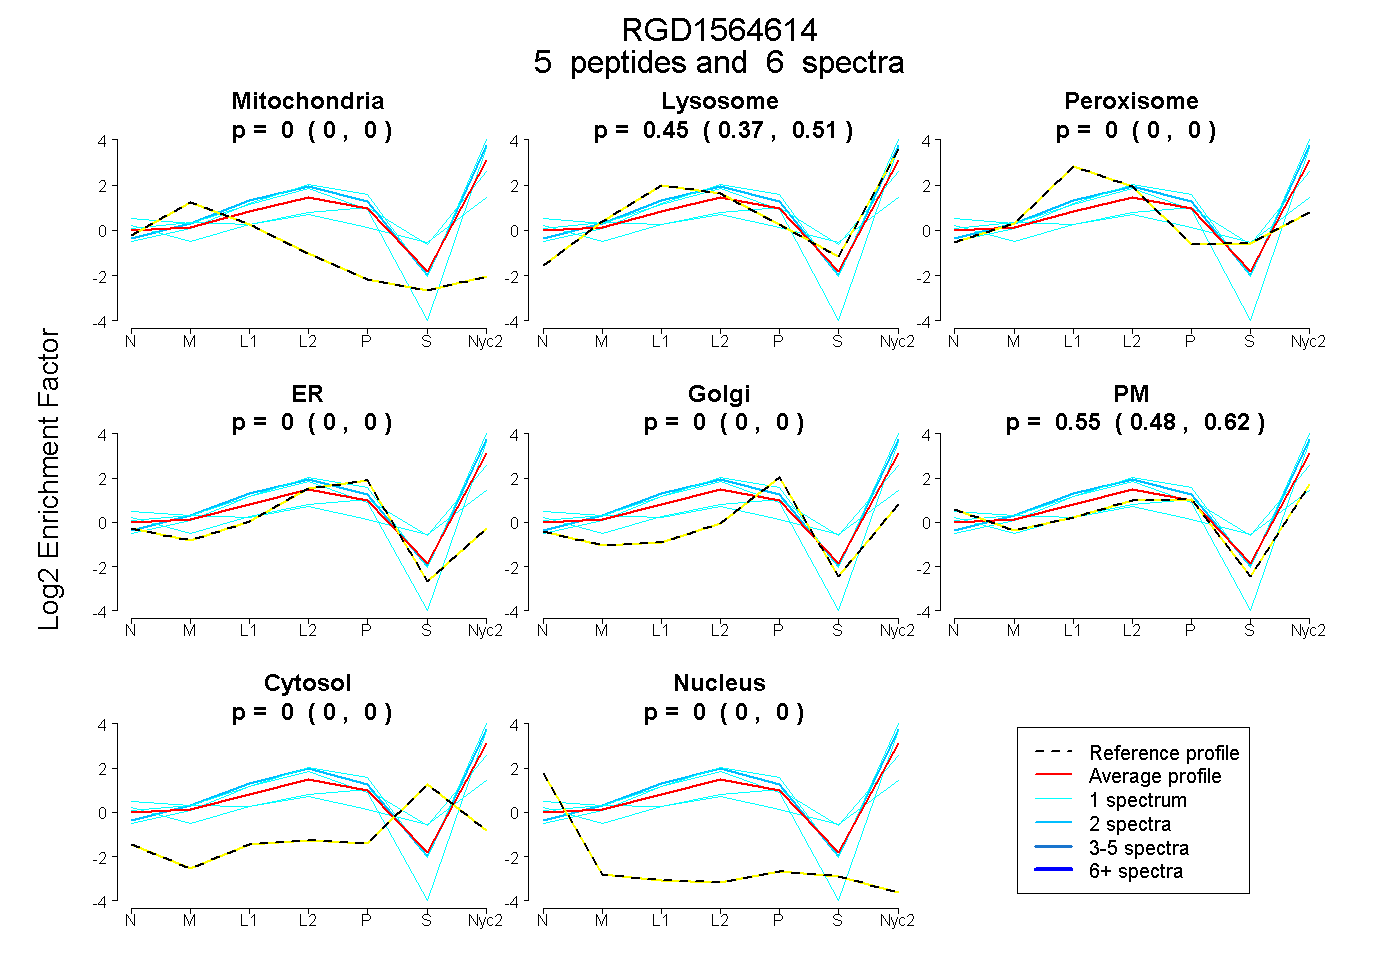
 5
5peptides
spectra
0.000 | 0.000
0.371 | 0.510
0.000 | 0.000
0.000 | 0.000
0.000 | 0.000
0.480 | 0.618
0.000 | 0.000
0.000 | 0.000
| Plot | Mito | Lyso | Perox | ER | Golgi | PM | Cytosol | Nucleus | |||||
| Expt A |
5 peptides |
6 spectra |
|
0.000 0.000 | 0.000 |
0.450 0.371 | 0.510 |
0.000 0.000 | 0.000 |
0.000 0.000 | 0.000 |
0.000 0.000 | 0.000 |
0.550 0.480 | 0.618 |
0.000 0.000 | 0.000 |
0.000 0.000 | 0.000 |
| 1 spectrum, WTTLPTCVEEK | 0.000 | 0.323 | 0.000 | 0.000 | 0.000 | 0.677 | 0.000 | 0.000 | ||
| 1 spectrum, WAQLPR | 0.000 | 0.658 | 0.000 | 0.000 | 0.000 | 0.342 | 0.000 | 0.000 | ||
| 2 spectra, ITCSQPPK | 0.000 | 0.647 | 0.000 | 0.000 | 0.000 | 0.353 | 0.000 | 0.000 | ||
| 1 spectrum, WSSPPR | 0.000 | 0.322 | 0.000 | 0.000 | 0.000 | 0.539 | 0.138 | 0.000 | ||
| 1 spectrum, SGSITCLQTGWSAQPSCIK | 0.046 | 0.199 | 0.142 | 0.000 | 0.000 | 0.426 | 0.187 | 0.000 |
| Plot | Lyso | Other | |||||||||||
| Expt C |
15 peptides |
42 spectra |
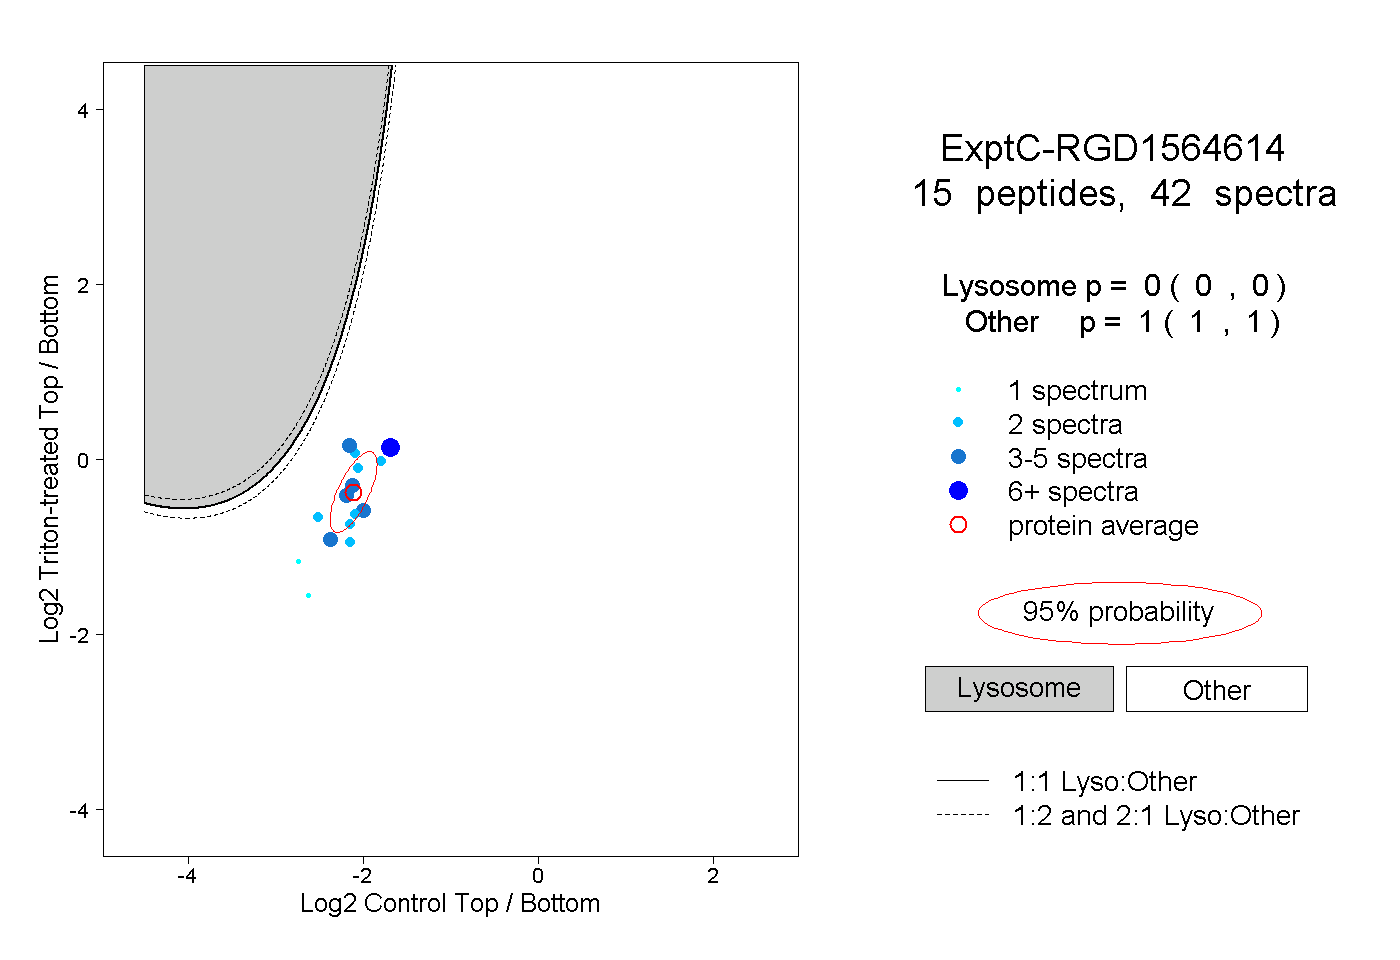 |
0.000 0.000 | 0.000 |
1.000 1.000 | 1.000 |
||||||||
| Plot | Lyso | Other | |||||||||||
| Expt D |
2 peptides |
2 spectra |
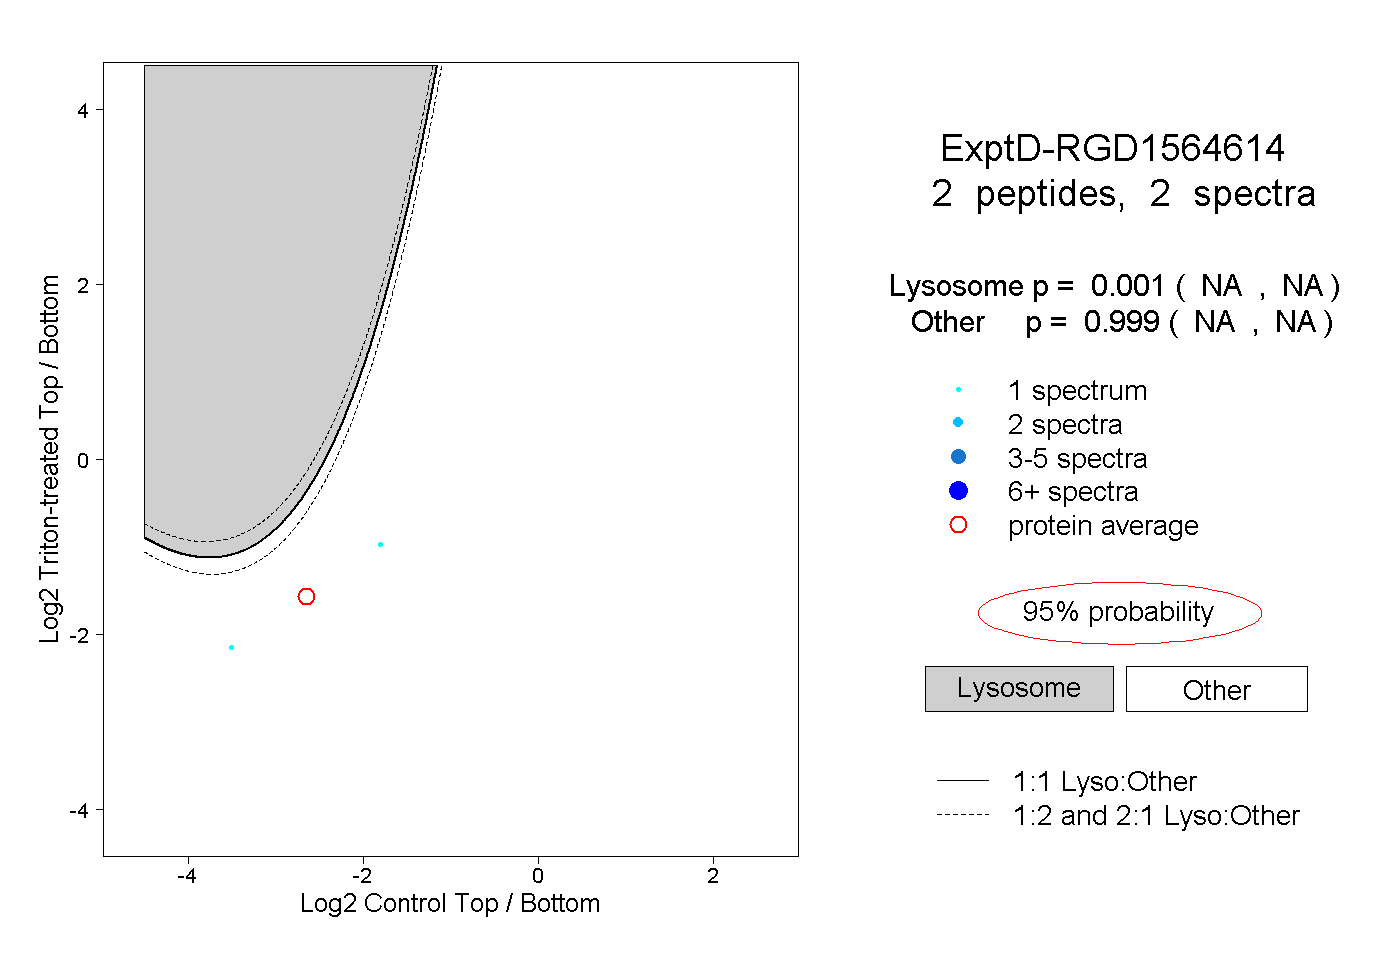 |
0.001 NA | NA |
0.999 NA | NA |