 3
3peptides
spectra
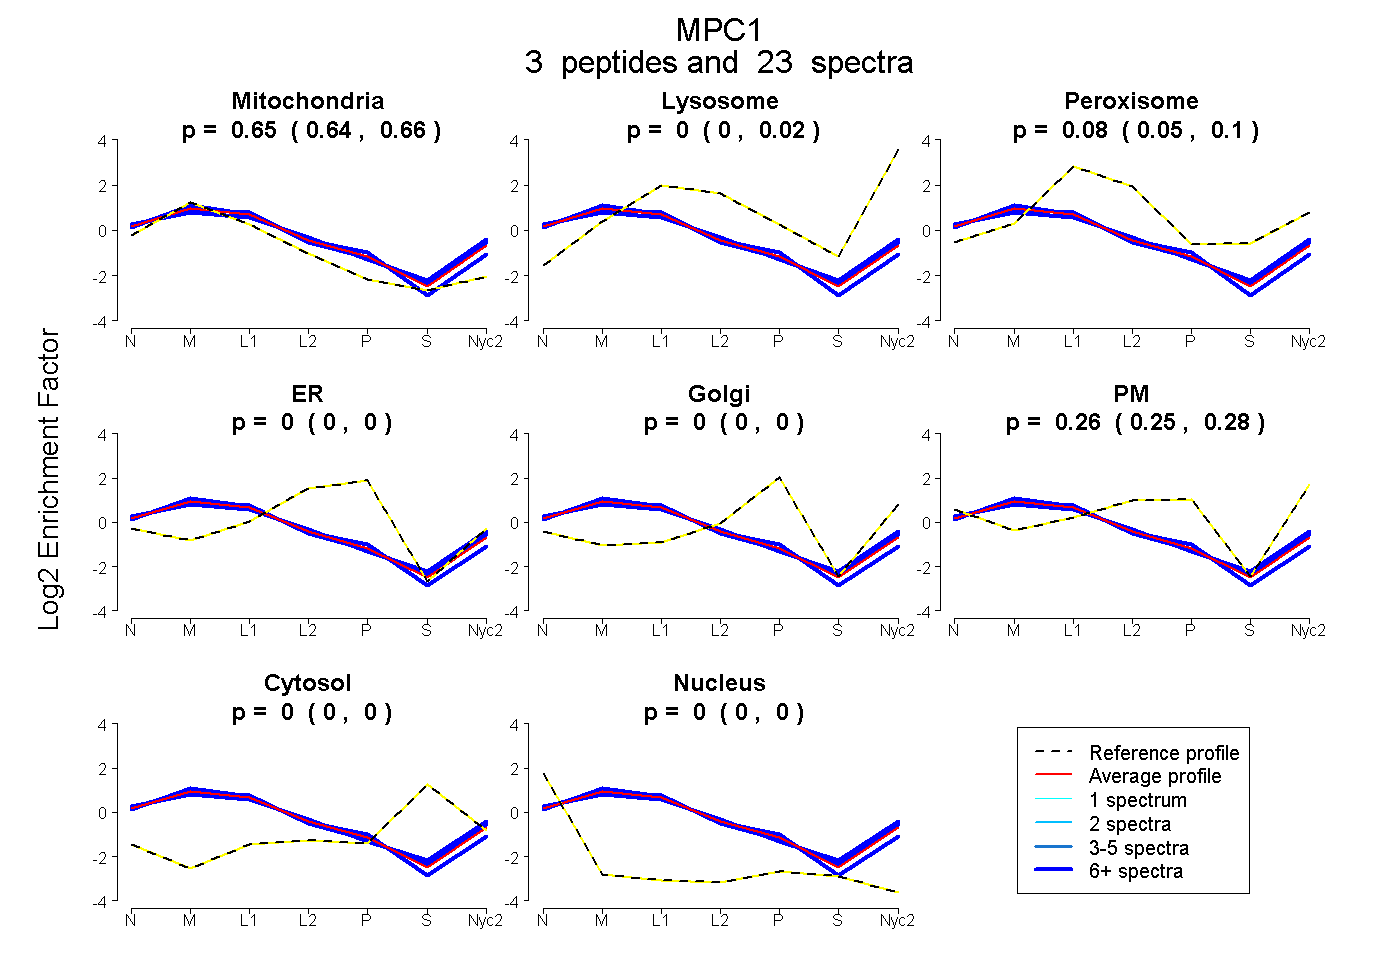
0.642 | 0.661
0.000 | 0.023
0.054 | 0.096
0.000 | 0.000
0.000 | 0.000
0.248 | 0.275
0.000 | 0.000
0.000 | 0.000
3peptides
spectra
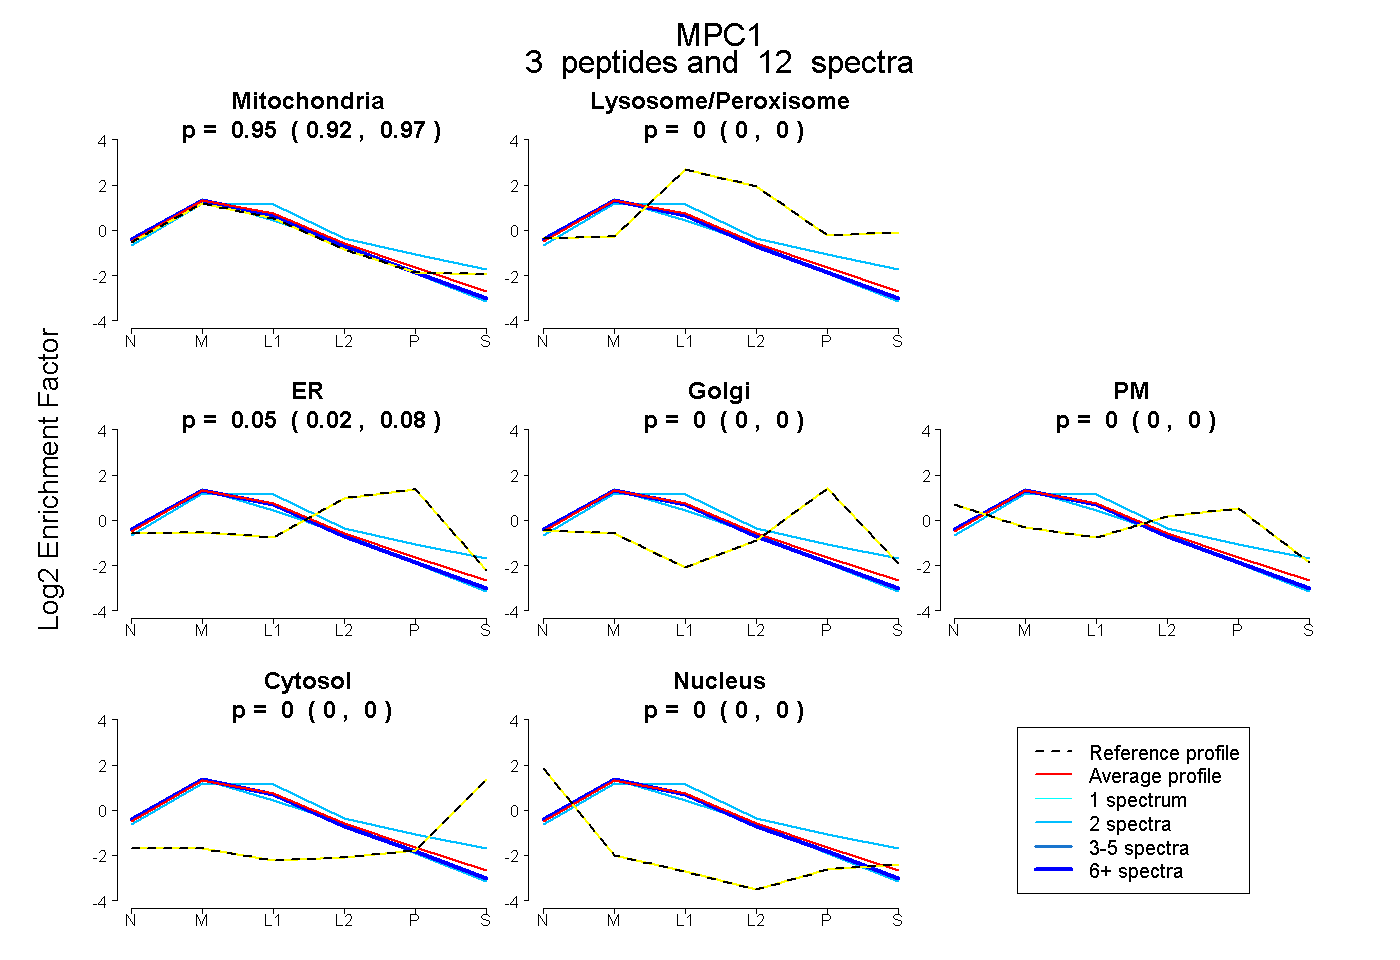
0.920 | 0.972
0.000 | 0.000
0.022 | 0.076
0.000 | 0.000
0.000 | 0.000
0.000 | 0.000
0.000 | 0.000
4peptides
spectra
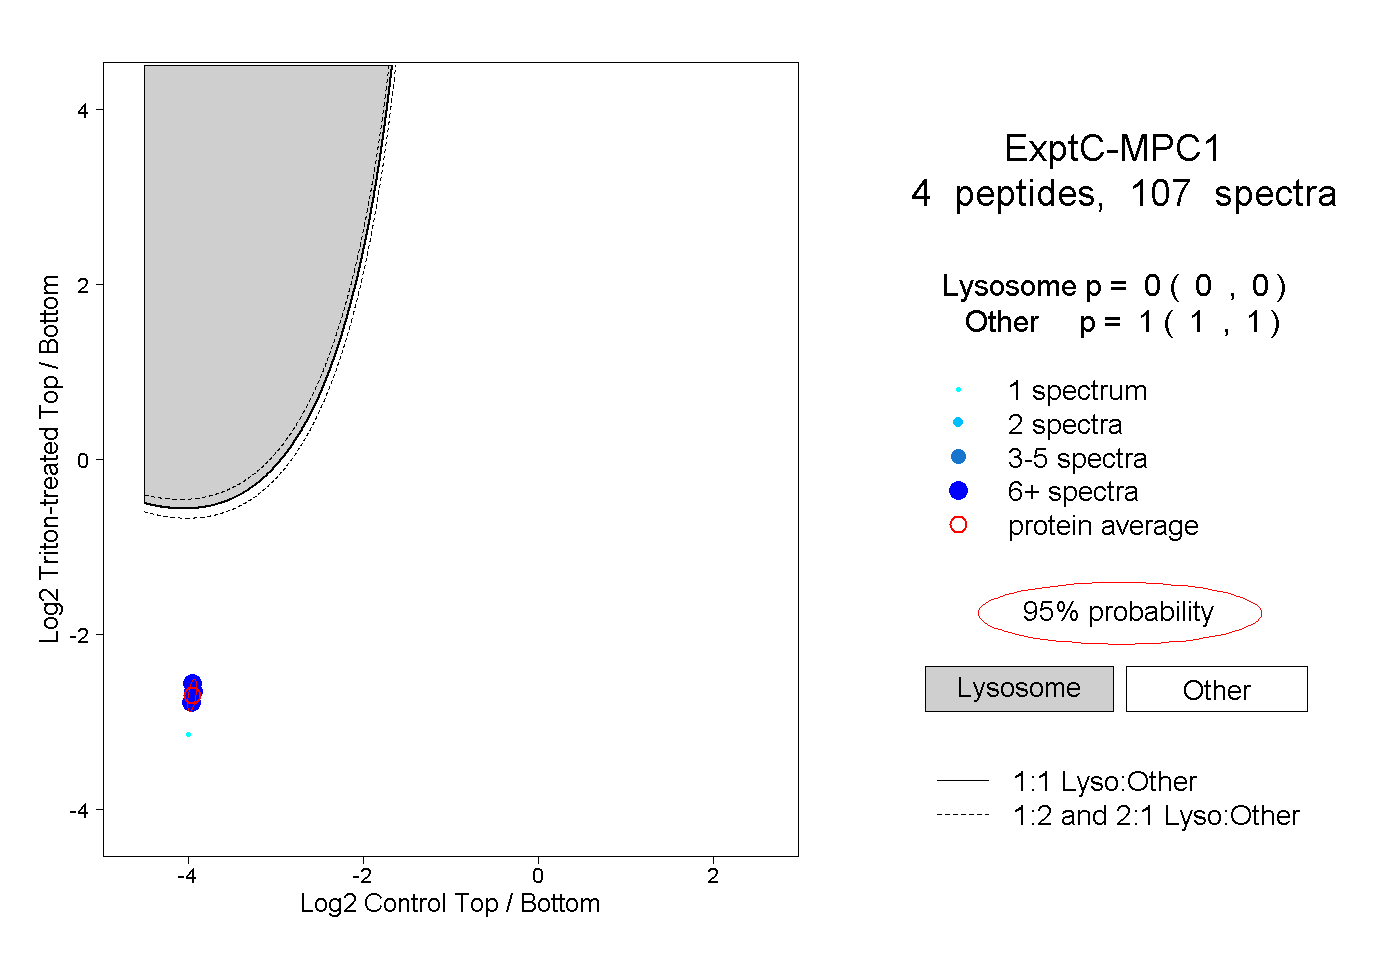
0.000 | 0.000
1.000 | 1.000
2peptides
spectra
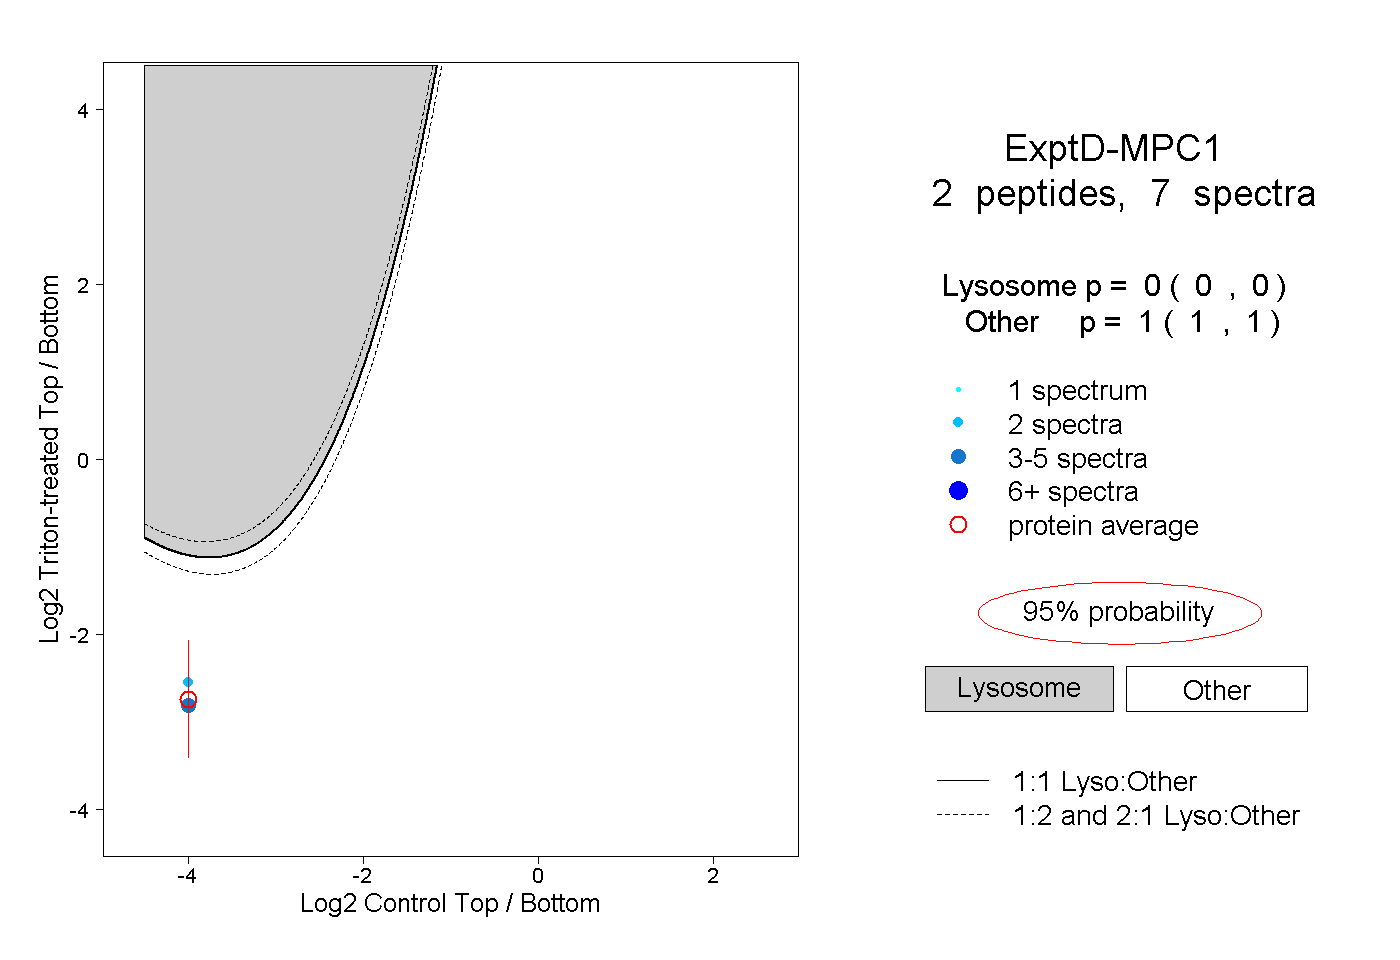
0.000 | 0.000
1.000 | 1.000