 9
9peptides
spectra
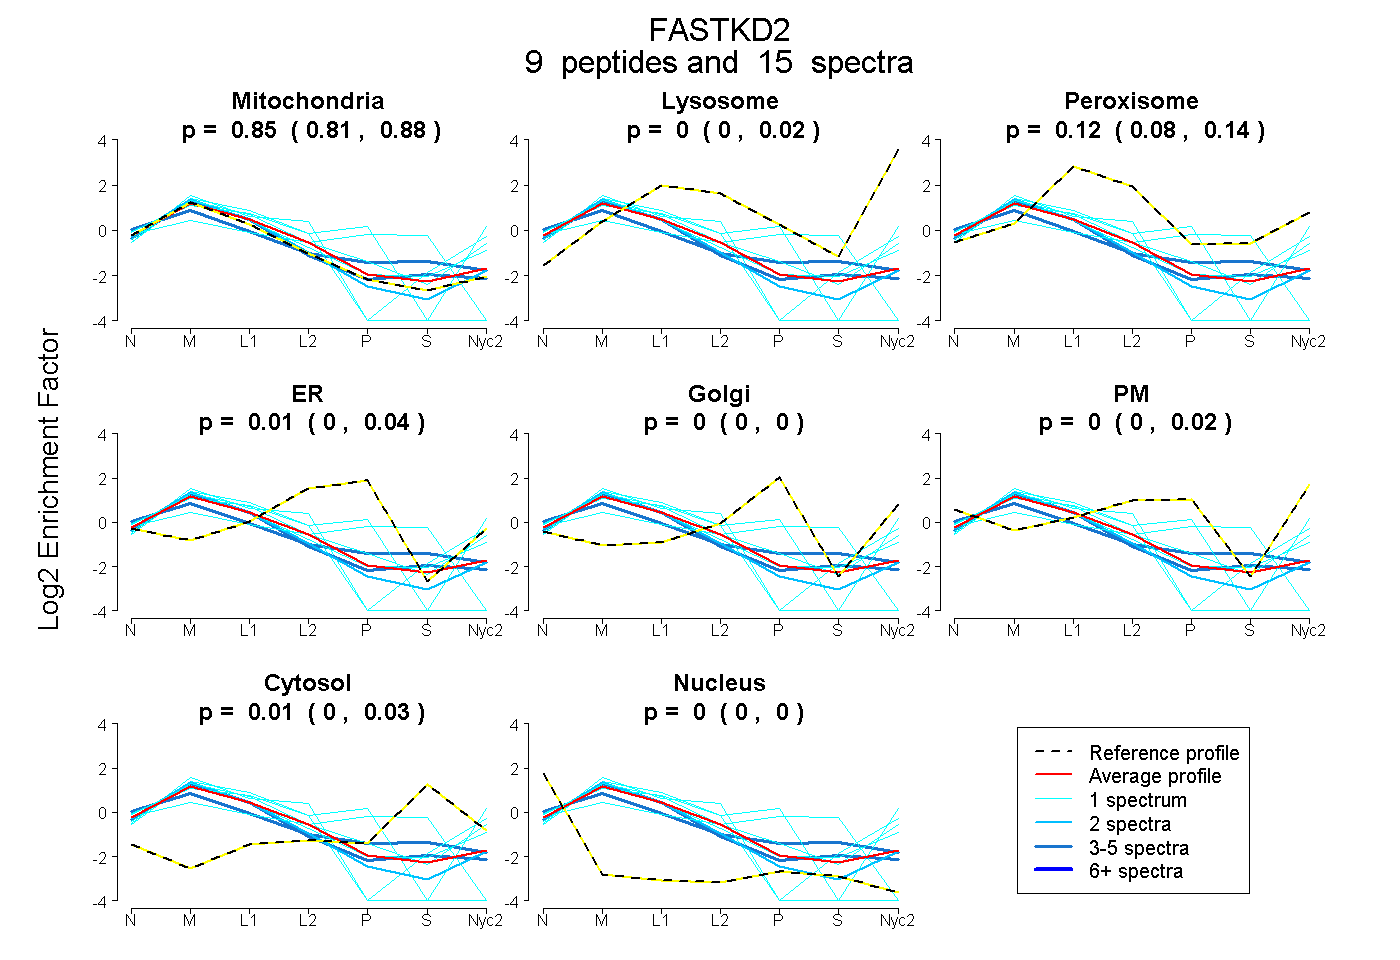
0.814 | 0.881
0.000 | 0.024
0.084 | 0.138
0.000 | 0.043
0.000 | 0.000
0.000 | 0.022
0.000 | 0.031
0.000 | 0.000
14peptides
spectra
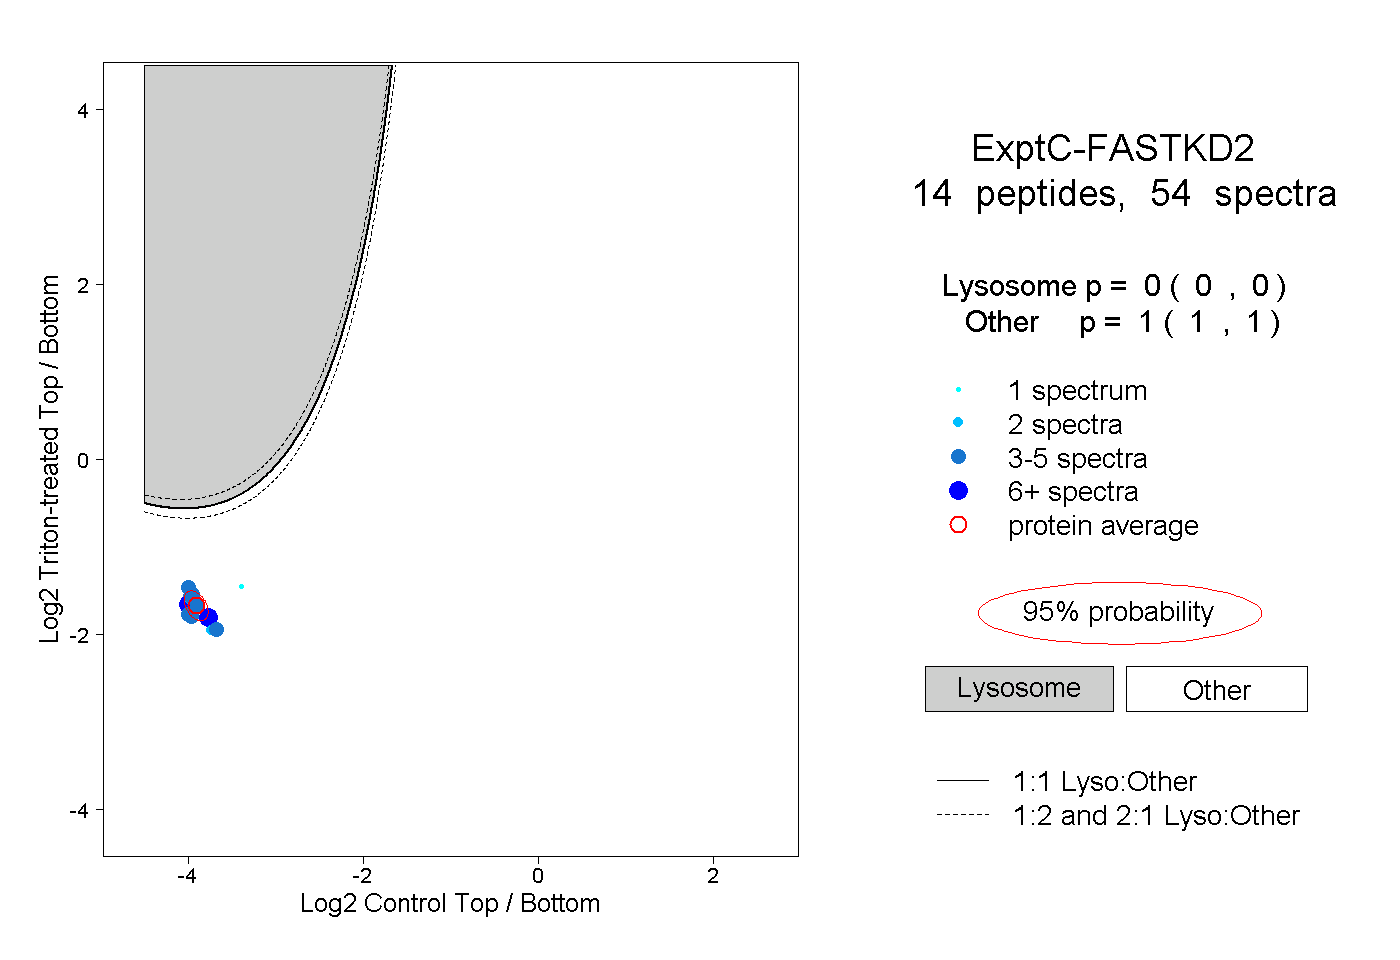
0.000 | 0.000
1.000 | 1.000
| Plot | Mito | Lyso | Perox | ER | Golgi | PM | Cytosol | Nucleus | |||||
| Expt A |
9 peptides |
15 spectra |
|
0.854 0.814 | 0.881 |
0.000 0.000 | 0.024 |
0.125 0.084 | 0.138 |
0.006 0.000 | 0.043 |
0.000 0.000 | 0.000 |
0.000 0.000 | 0.022 |
0.014 0.000 | 0.031 |
0.000 0.000 | 0.000 |
||
| Plot | Lyso | Other | |||||||||||
| Expt C |
14 peptides |
54 spectra |
|
0.000 0.000 | 0.000 |
1.000 1.000 | 1.000 |